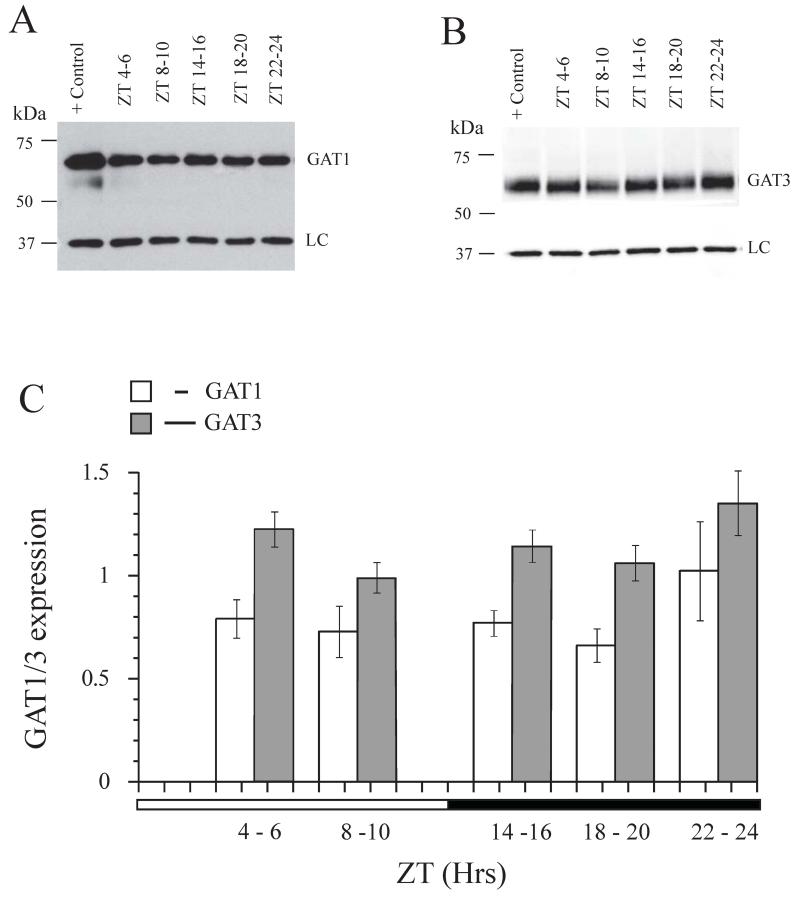
Figure 2. Diurnal expression of GAT3 and GAT1 in the SCN of rats on a 12:12h LD cycle.
A. Western blot for GAT1, each band represents one of five zeitgeber times (ZT)s: ZT 4 - 6, ZT 8 - 10; ZT 14 - 16; ZT 18 - 20; ZT 22 - 24. Positive control is the cerebral cortex. Loading control (LC): GAPDH. B. Western blot for GAT3. Positive control is the thalamus. C. Graph shows GAT1 and GAT3 expression at different ZTs. The quantification of the optical density of the bands was performed, than data were normalized to the loading control. GAT1: 4 gels in duplicate i.e. 8 bands for each ZT. GAT3: 5 gels in duplicate i.e.10 bands for each ZT. The light and dark phases of the cycle are shown on the horizontal bar under the graph. Neither GAT1 nor GAT3 showed a diurnal rhythm of expression. Data shown as mean ± SEM. A detailed description of the antibodies is in Table 1 and in Methods. The rest of the notations are the same, as those in Fig.1.

