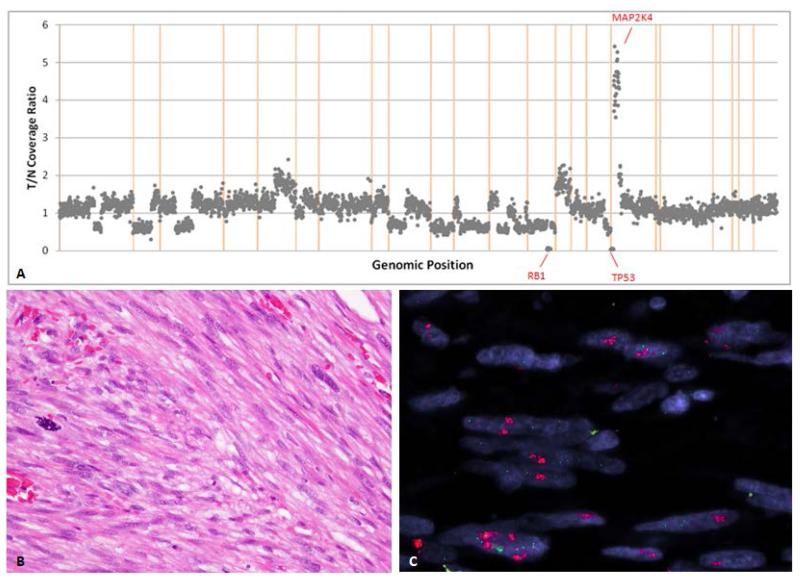
Figure 3.
Schematic representation of copy number alterations in Case 3 (A) showing gains of 17p11-13 and losses of 10q, 13q, 16q and 17p. (B) H&E image showing typical morphology of the tumor composed of spindle cells in fascicles with cytologic atypia and mitotic activity. (C) FISH for myocardin (MYOCD) gene showing amplification (red signal).

