Figure 1.

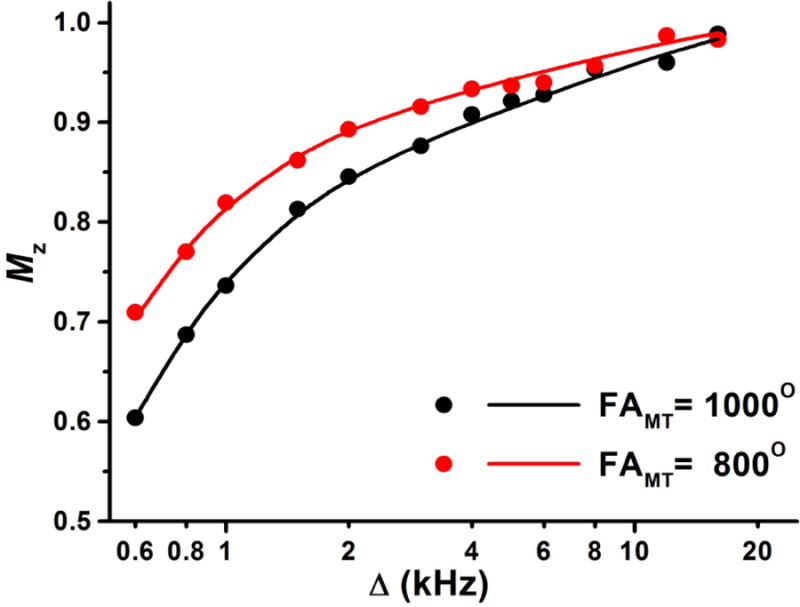
Experimental (points) and fitted (lines) Z-spectra of the human liver. Normalized longitudinal magnetization (Mz) is plotted as a function of the offset frequency (Δ) at variable FAMT values.

Experimental (points) and fitted (lines) Z-spectra of the human liver. Normalized longitudinal magnetization (Mz) is plotted as a function of the offset frequency (Δ) at variable FAMT values.