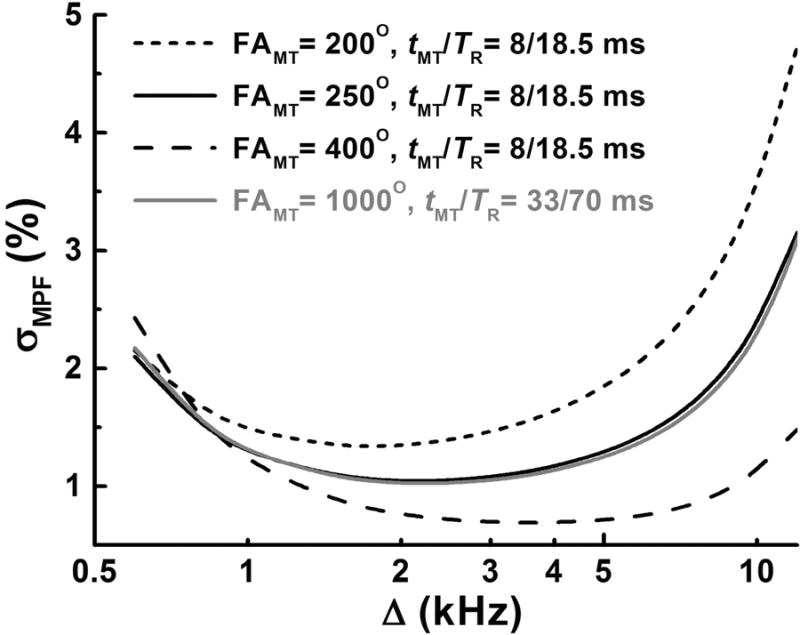
Figure 2.

Total absolute MPF measurement error (σMPF) simulated using the error propagation model (18) and plotted as a function of the offset frequency (Δ) at variable FAMT and timing parameters of the sequence (TR and tMT). Simulations are presented for the measured MPF value of 6%, T1 = 1.1 s, SNR for the reference image of 70, and sequence parameters used in the protocols for the clinical study and Z-spectroscopic data acquisition.
