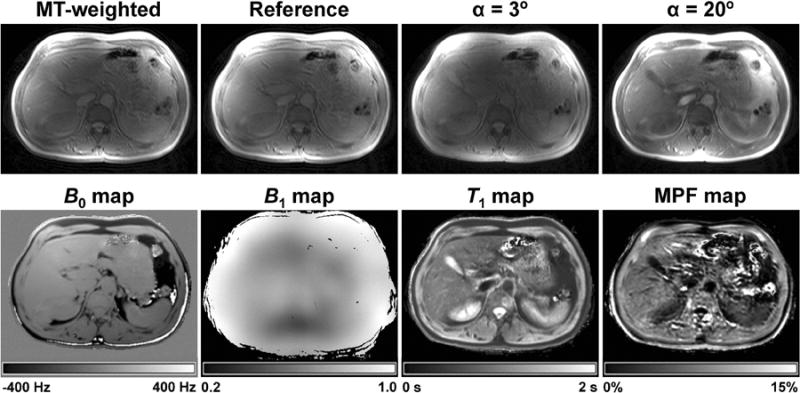
Figure 3.

Example source images and parametric maps of the abdomen obtained from an HCV patient with fibrosis score F2 using the fast single-point MPF mapping method. Top row: MT-weighted image, reference image, and VFA images with α = 3 and 20°. Bottom row: B0 and B1 field maps, T1 map, and MPF map. Grayscale ranges correspond to the frequency shift range from -400 to 400 Hz on the B0 map, B1 scaling factor range from 0.2 to 1.0 on the B1 map, T1 range from 0 to 2 s on the T1 map, and MPF range from 0 to 15% on the MPF map.
