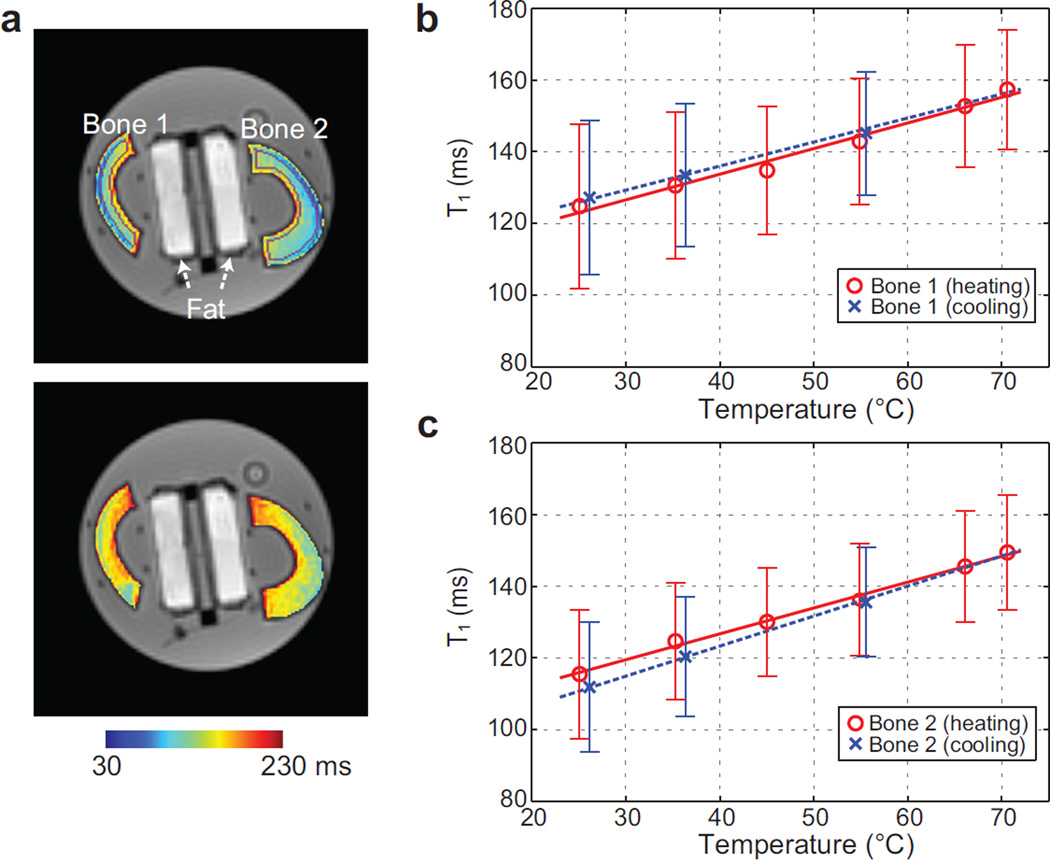
Figure 2.
Calibration results. (a) Bone T1 maps at temperatures of 25°C (top) and 70°C (bottom), overlaid on UTE images at 8°. Two tubes containing fat (used for a different study) are positioned between the bone samples. ROIs automatically determined to quantify T1 in each bone sample are denoted in purple in the upper image. (b-c) The mean T1 and error bar from the volume of interest is shown over different temperatures for each bone sample. Linear regression lines during the heating and cooling periods are plotted as well. An apparent linear increase of T1 with temperature is demonstrated.

