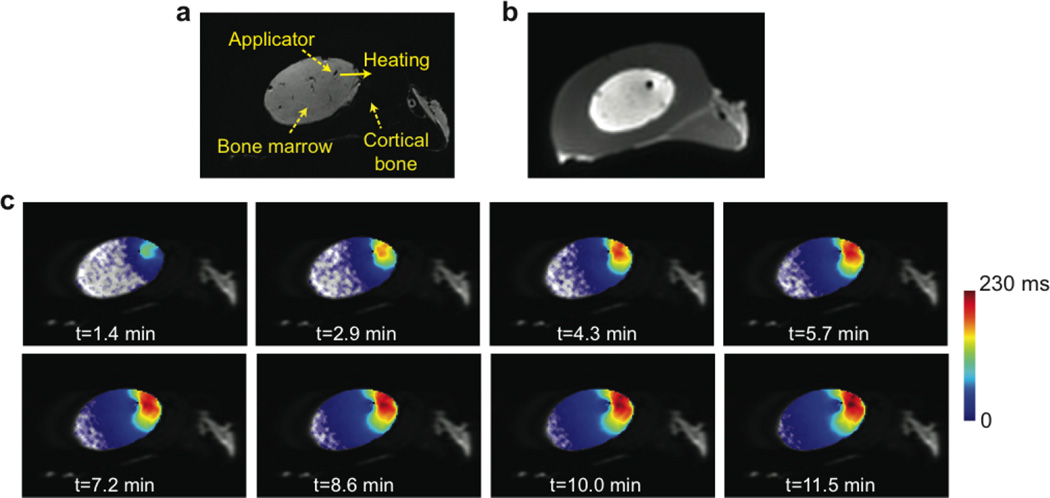
Figure 3.
Temperature mapping during transient state. (a) Gradient-echo image with denoted applicator location and heating direction. (b) Corresponding UTE image before heating, visually delineating cortical bone. (c) Maps of T2 changes between the baseline and each time point after heating began, overlaid on FSE images. A T2 increase over time in the heated region of the bone marrow can be seen. Please note limited T2 increases near the applicator due to water cooling.

