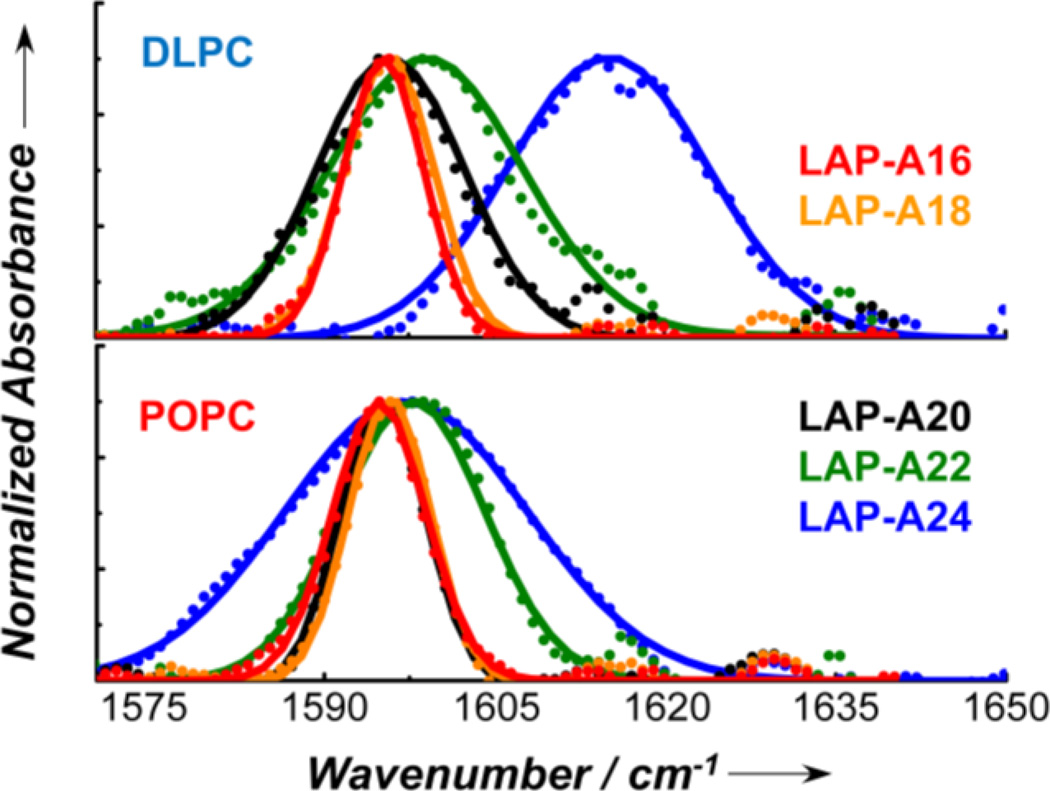
Figure 1.
Normalized and baseline corrected (see the Supporting Information) amide I bands (dots) arising from the 13C=18O isotopically labeled carbonyls in LAP-An peptides in DLPC and POPC membranes, as indicated. The solid line in each case corresponds to a fit of the spectrum to a Gaussian function and the resultant peak frequency and bandwidth are given in Table 1.

