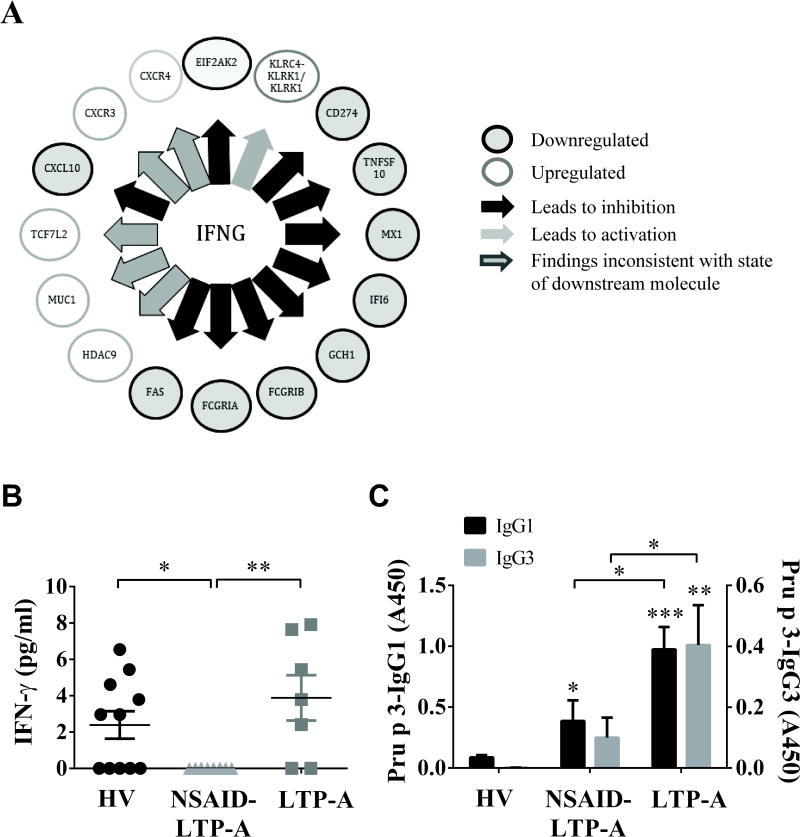
Fig 2. LTP-specific IgG1/IgG3 in LTP-A serums and repressed IFN-γ and IFN-γ regulated genes in NSAID-LTP-A.
A) Representation of IFNG as an upstream regulator of differentially regulated genes in NSAID-LTP-A compared to LTP-A, as identified by IPA. The arrows connect genes whose expression is altered and may be regulated by IFNG. The style of the lines defines the direction of change. The color of the node indicates the direction of the gene regulation. Grey: down-regulated; blank: up-regulated. B) Serum levels of IFN-γ and C) IgG1 and IgG3 anti-Pru p 3 in the indicated groups. Data are expressed as mean±SEM. *p<.05, **p<.01, ***p<.001 compared to HV unless otherwise indicated.

