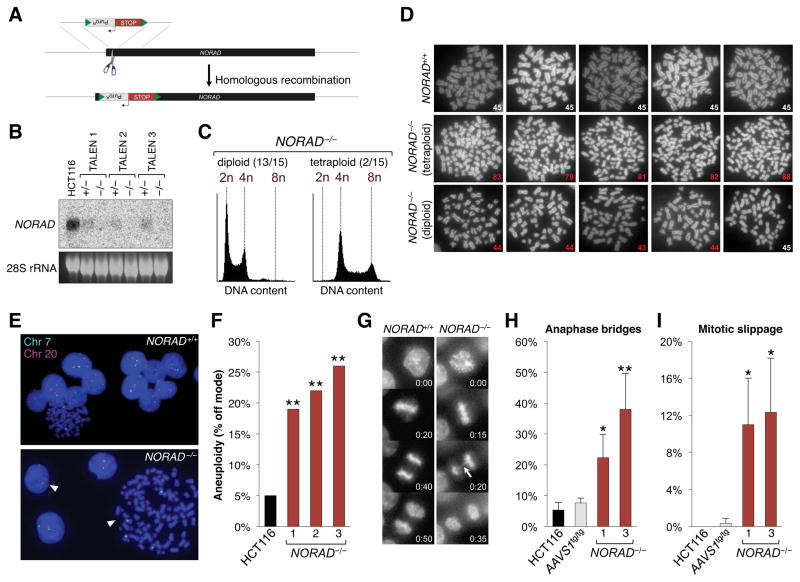
Figure 2. Genetic inactivation of NORAD results in chromosomal instability in human cells.
(A) NORAD was inactivated in human cell lines using custom TALEN pairs (represented as scissors) that cleave within the first 300 nucleotides of the gene, thereby stimulating the insertion of a puromycin resistance cassette (PuroR) followed by tandem polyadenylation signals (STOP). Green triangles represent loxP sites.
(B) Northern blot analysis of NORAD in HCT116 clones of the indicated genotypes.
(C) Flow cytometry histograms showing DNA content, as measured by propidium iodide staining, in representative diploid and tetraploid NORAD−/− HCT116 clones.
(D) Metaphase spreads of wild-type HCT116 cells and representative tetraploid and diploid NORAD−/− clones. The number in the lower right corner of each image shows the number of chromosomes present. Abnormal chromosome numbers indicated in red.
(E) Representative images of chromosome 7 and 20 FISH in NORAD+/+ and NORAD−/− HCT116 cells. White arrowheads highlight cells with chromosome loss or gain.
(F) NORAD−/− cells exhibit significantly elevated levels of aneuploidy. At least 100 interphase nuclei in each of 3 independent knockout clones were assayed for chromosome 7 and 20 using DNA FISH and the frequency of cells exhibiting a non-modal chromosome number was scored. **p<0.005, chi-square test.
(G) Representative time-lapse images of mitoses in NORAD+/+ and NORAD−/− HCT116 cells. Time stamp indicates minutes elapsed.
(H, I) Quantification of the percentage of mitoses exhibiting the indicated mitotic errors in time-lapse imaging experiments. Values represent the average of 3 independent experiments with 39–100 mitoses imaged per genotype per experiment. Error bars represent standard deviations. *p<0.05; **p<0.01, Student’s t-test.
See also Figures S1, S2, and S3.

