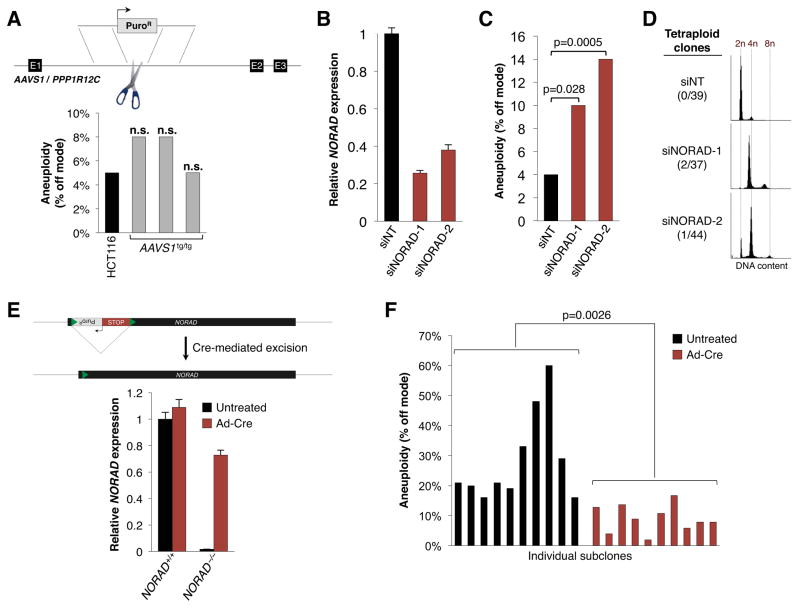
Figure 3. Chromosomal instability is specifically due to NORAD inactivation.
(A) Insertion of a puromycin resistance cassette at the AAVS1/PPP1R12C locus was performed using a published TALEN pair (Hockemeyer et al., 2009; Sanjana et al., 2012) and the frequency of aneuploidy in homozygous targeted HCT116 clones was assessed using DNA FISH as in Figure 2E–F. n.s., not significant (chi-square test).
(B) qRT-PCR analysis of NORAD expression, relative to 18S rRNA, in HCT116 cells 48 hours after transfection with control (siNT) or NORAD-targeting siRNAs.
(C) Aneuploidy in siRNA-transfected HCT116 cells 12 days after siRNA transfection, assayed as in Figure 2E–F. At least 200 nuclei were scored per condition. P value calculated by chi-square test.
(D) Flow cytometry histograms showing DNA content, as measured by propidium iodide staining, in representative HCT116 subclones generated after transfection with the indicated siRNAs.
(E) qRT-PCR analysis of NORAD expression in NORAD+/+ and NORAD−/− HCT116 cells with or without adenovirus-Cre infection.
(F) Subclones generated from untreated or adenovirus-Cre infected NORAD−/− HCT116 cells were scored for aneuploidy as in Figure 2E–F. P value calculated by Student’s t-test.

