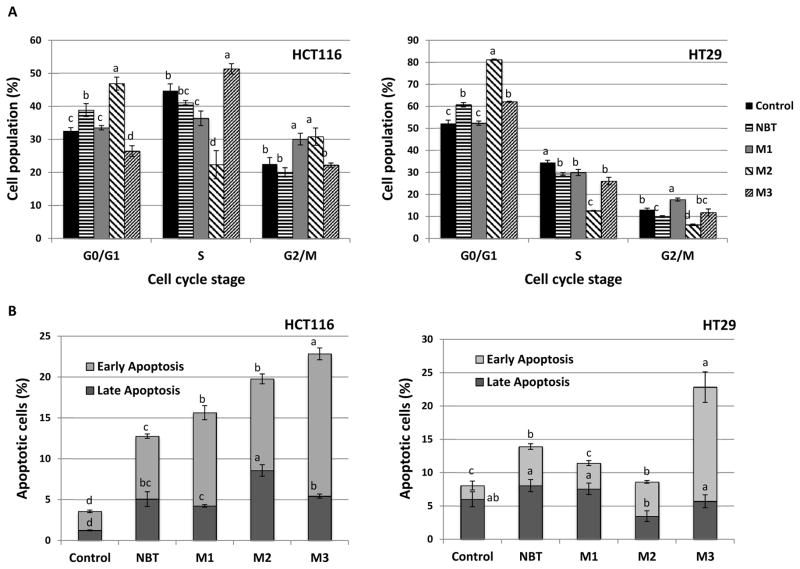
Figure 5.
Effects of NBT (40 μM), M1 (40 μM), M2 (40 μM) and M3 (20 μM) on cell cycle progression (A) and apoptosis (B) of HCT116 and HT29 human colon cancer cells. Cells were seeded in 6-well plates for 24 h, and then treated with NBT and its metabolites. After 24 or 48h of treatments, cells were harvested and subject to cell cycle and apoptosis analysis, respectively Data are shown as mean ± SD. Different notations in the bar charts indicate statistical significance (p < 0.01, n = 3) by ANOVA.

