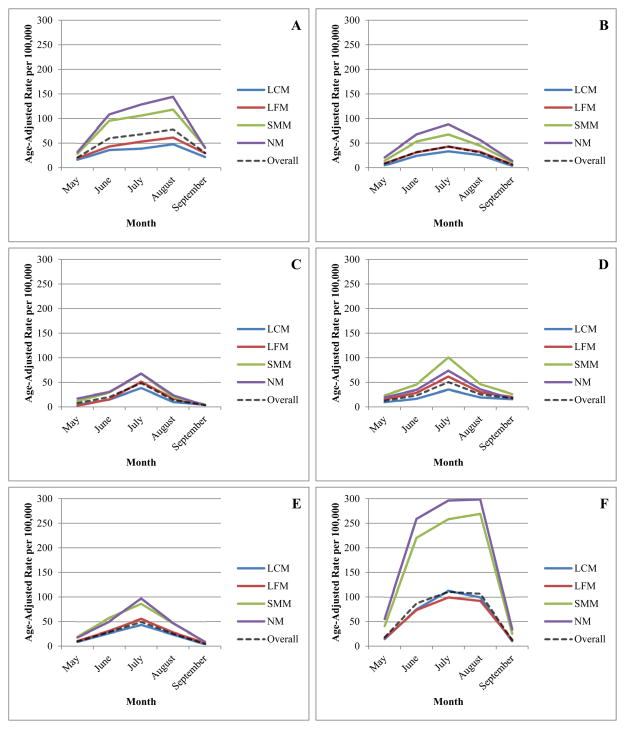
Fig. 6.
Monthly age-adjusted incidence rates for emergency department visits for heat stress illness by county urbanicity (LCM = large central metropolitan, LFM = large fringe metropolitan, SMM = small–medium metropolitan, and NM = nonmetropolitan) in 14 National Environmental Public Health Tracking states, 2005–2010, by climate region (A = Southeast, B = Northeast, C = Southwest, D = West, E = Upper Midwest, F = Ohio Valley)

