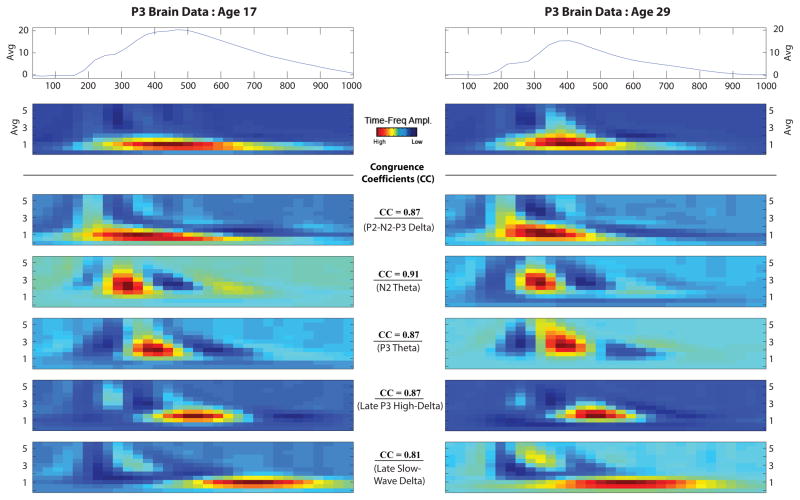
Figure 1.
Grand average waveforms and time-frequency component alignment from the age 17 and age 29 decompositions. Grand-averaged time-domain and time-frequency (Avg) plots derived from participant data (N = 259) are presented at the top and displayed corresponding to assessment age. The five time-frequency components retained from the principal components analysis decomposition are presented below the grand averages and are arranged by ERP time course for presentation purposes. For all time-frequency plots, x-axis is time from stimulus onset (0 ms) to 1000 ms, and y-axes range from 0 – 5.75 Hz. Analogous TF-PCs derived at age 17 (left panel) and age 29 (right panel) were aligned based on patterns of TF-PC peak correlations and cross-factor loadings. Congruence coefficients (CC) associated with the TF-PC pairings are also indicated.

