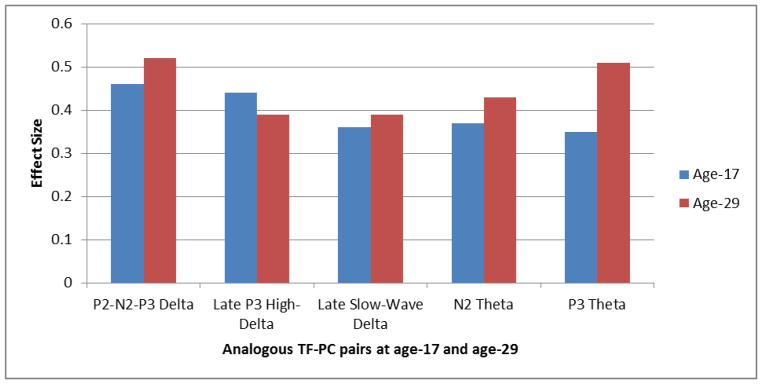
Figure 4.
Effect size graph for the Any-EXT vs. Control comparisons on the analogous TF-PC pairs at age 17 and age 29. Effect sizes corresponding to the composite Any-EXT group (i.e., any participant meeting lifetime diagnosis for an EXT disorder by age 29; n = 185) versus Controls (n = 74) are displayed for analogous TF-PC pairs at age 17 and age 29. Effect sizes were obtained by converting the mean weighted energy unit difference between controls and the Any-EXT group for each of two assessment ages examined in the MANOVAs into statistics analogous to Cohen’s d, using a standard formula for converting t-statistics to d (Rosenthal, 1991).

