
Figure 3.
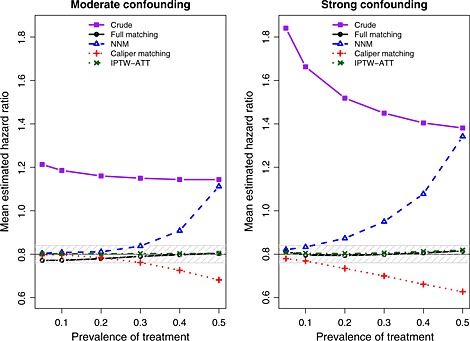
Mean estimated hazard ratio across simulated datasets. NNM, nearest neighbor matching; IPTW, inverse probability of treatment weighting; ATT, average effect of treatment in the treated.
Official websites use .gov
A
.gov website belongs to an official
government organization in the United States.
Secure .gov websites use HTTPS
A lock (
) or https:// means you've safely
connected to the .gov website. Share sensitive
information only on official, secure websites.
Mean estimated hazard ratio across simulated datasets. NNM, nearest neighbor matching; IPTW, inverse probability of treatment weighting; ATT, average effect of treatment in the treated.