
Figure 5.
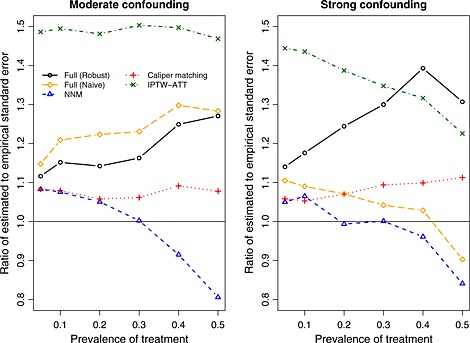
Ratio of mean estimated standard error to empirical standard deviation of the estimated log‐hazard ratio. NNM, nearest neighbor matching; IPTW, inverse probability of treatment weighting; ATT, average effect of treatment in the treated.
Official websites use .gov
A
.gov website belongs to an official
government organization in the United States.
Secure .gov websites use HTTPS
A lock (
) or https:// means you've safely
connected to the .gov website. Share sensitive
information only on official, secure websites.
Ratio of mean estimated standard error to empirical standard deviation of the estimated log‐hazard ratio. NNM, nearest neighbor matching; IPTW, inverse probability of treatment weighting; ATT, average effect of treatment in the treated.