
Figure 12.
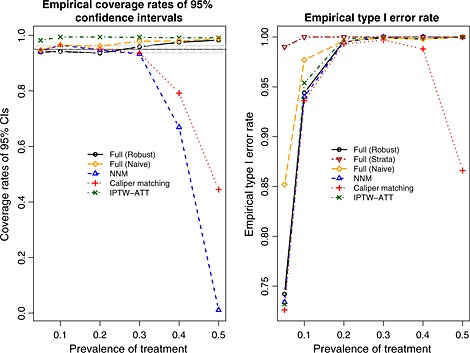
Mixed covariates: empirical coverage rates of 95% confidence intervals (CIs) and empirical type I error rates. NNM, nearest neighbor matching; IPTW, inverse probability of treatment weighting; ATT, average effect of treatment in the treated.