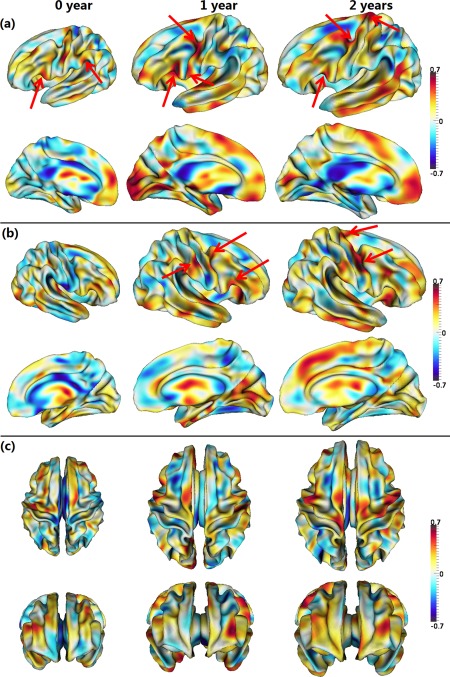
Figure 6.

Pearson's correlation coefficients between the cortical fiber density and cortical thickness from 33 infants at 0, 1, and 2 years of age. Warm colors indicate strong positive correlation, while cool colors indicate strong negative correlation. Red arrows point out several regions with strong positive correlations. Pictures in (a–c) show correlation maps in different views. [Color figure can be viewed in the online issue, which is available at http://wileyonlinelibrary.com.]
