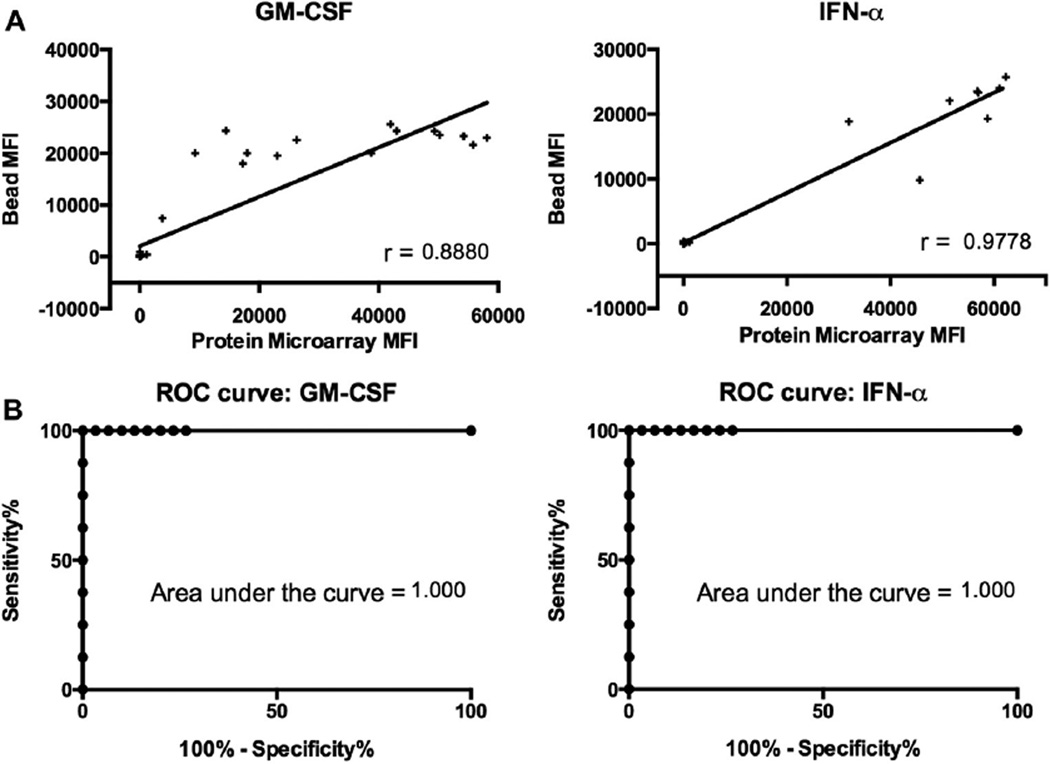
FIG 4.
Comparison of protein microarray performance with an established bead-based assay. A, Corresponding MFI values from protein microarrays and a bead-based assay were plotted for the targets GM-CSF and IFN-α, and Pearson correlation coefficients were determined. All P values were less than .005. B, Receiver operating characteristic (ROC) curves were generated to assess the performance of protein microarrays, with a bead-based assay used as the gold standard. P values were less than .05 for all areas under the curve.

