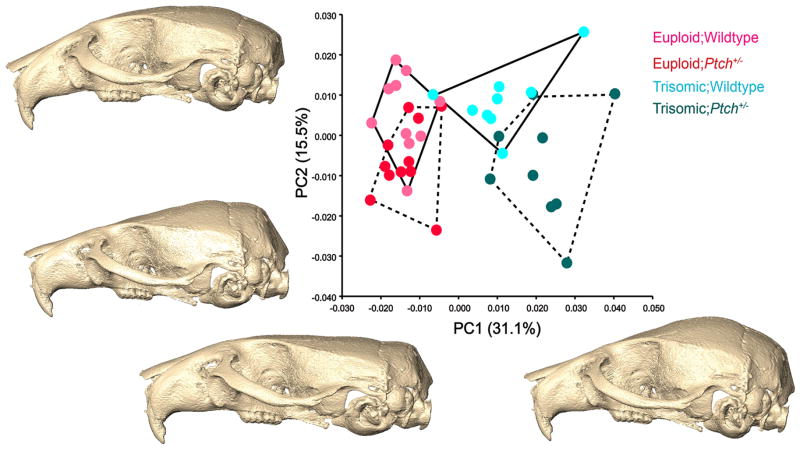
Fig 2.
Principal component (PC) analysis of forty 3D cranial landmarks. PC1 primarily captures the differences between the euploid and trisomic morphology, with some distinction between the Ptch+/− (dashed convex hulls) and wildtype (solid convex hulls) individuals in the respective euploid and triosmic groups. The shape changes along the PCs are represented by surface reconstructions computed from the grand mean of the total dataset and warped according to the variation defined along the respective PC scores. PC1 shows shape changes consistent with ploidy in the neurocranium, which is markedly more rounded and raised in the Ts;Ptch+/− and Ts;WT compared to the Eu;Ptch+/− and Eu;WT. PC2 mainly accounts for the within-group variation in all four groups, more so than in PC1, and also shape changes between the Ts;WT and Ts;Ptch+/− . The morphological changes on PC2 relate to the orientation of the snout and width of neucrocranium (not shown).

