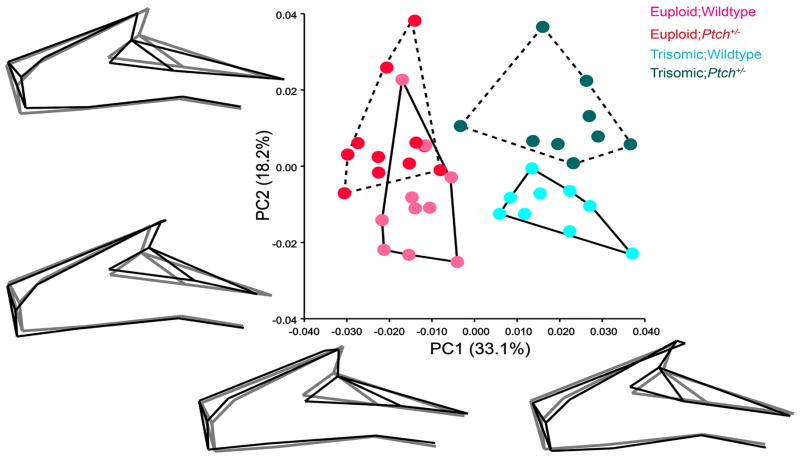
Fig 3.
Principal component analysis of twenty-three facial landmarks. PC1 separates the euploid and trisomic groups, showing little difference between the Ptch+/− (dashed convex hulls) and their wildtype (solid convex hulls) individuals along this axis. The wireframe diagrams illustrate the shape changes (in black) from the negative to the positive end along each PC relative to the grand mean shape (in gray) computed from all the specimens in the sample. PC1 captures mediolateral expansion and contraction of the face (narrow and elongated in euploids and laterally expanded in both the trisomic groups), marked by the position of the orbital margin. PC2 accounts for changes between the Ptch+/− and WT mice, particularly between the Ts;Ptch+/− and Ts;WT. Shape changes along PC2 captures differences in the relative length of the snout, being shorter and retracted in the Ptch+/− mice compared to their WT counterparts.

