
Fig 5.
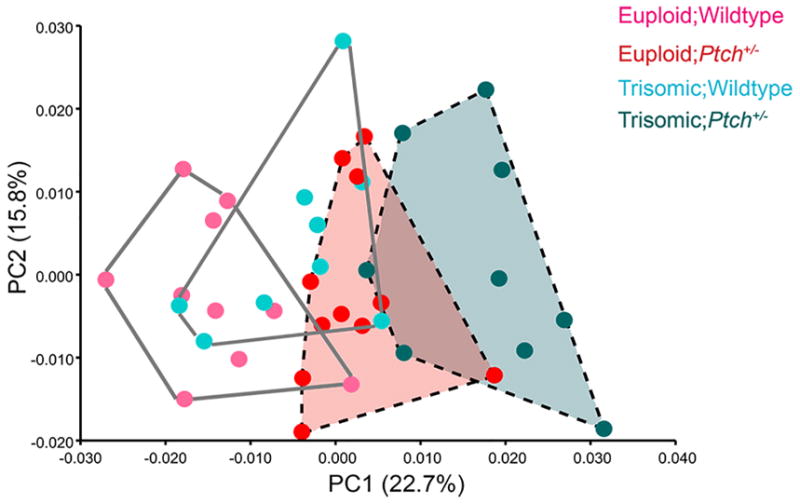
Principal component analysis on the multivariate regression residuals. The euploid and trisomic mice are less distinct from one another after the effects of size have been removed from the analysis. The Eu;Ptch+/− and Ts;Ptch+/− (dashed convex hulls) both occupy the positive end of PC1, showing slight overlap and subtle similarities along this axis.