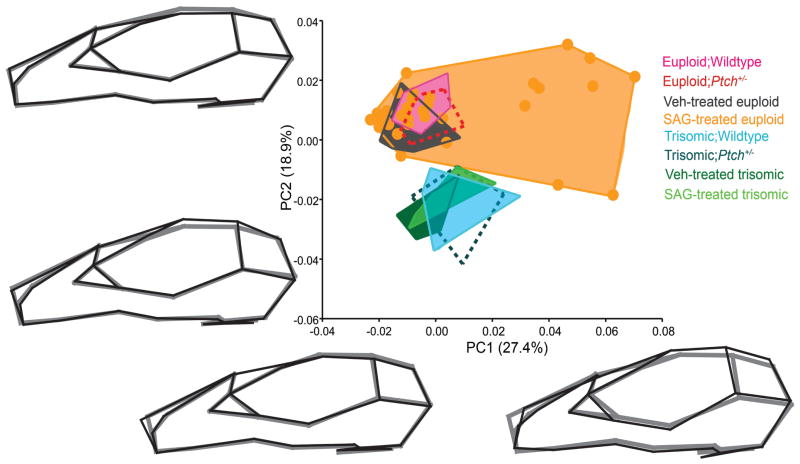
Fig 6.
Principal component analysis of all Ptch+/− mice (the Eu;Ptch+/− and Ts;Ptch+/− groups are indicated by the dashed convex hulls) and their wildtype littermates (solid convex hulls), and the SAG and Vehicle (Veh) treated euploid and trisomic mice (solid convex hulls). The plot illustrates the difference between an acute and chronic up-regulation of SHH on craniofacial morphology. The shape changes (in black) along the respective PCs are represented by wireframe diagrams of the extreme shapes at the end of each axis relative to the grand mean shape (in gray) computed from all the specimens in the dataset. PC1 separates a subset of affected SAG-treated mice from all the other groups in the sample. PC2 distinguishes all the trisomic mice, irrespective of gentoype, from all the euploid mice in the sample.

