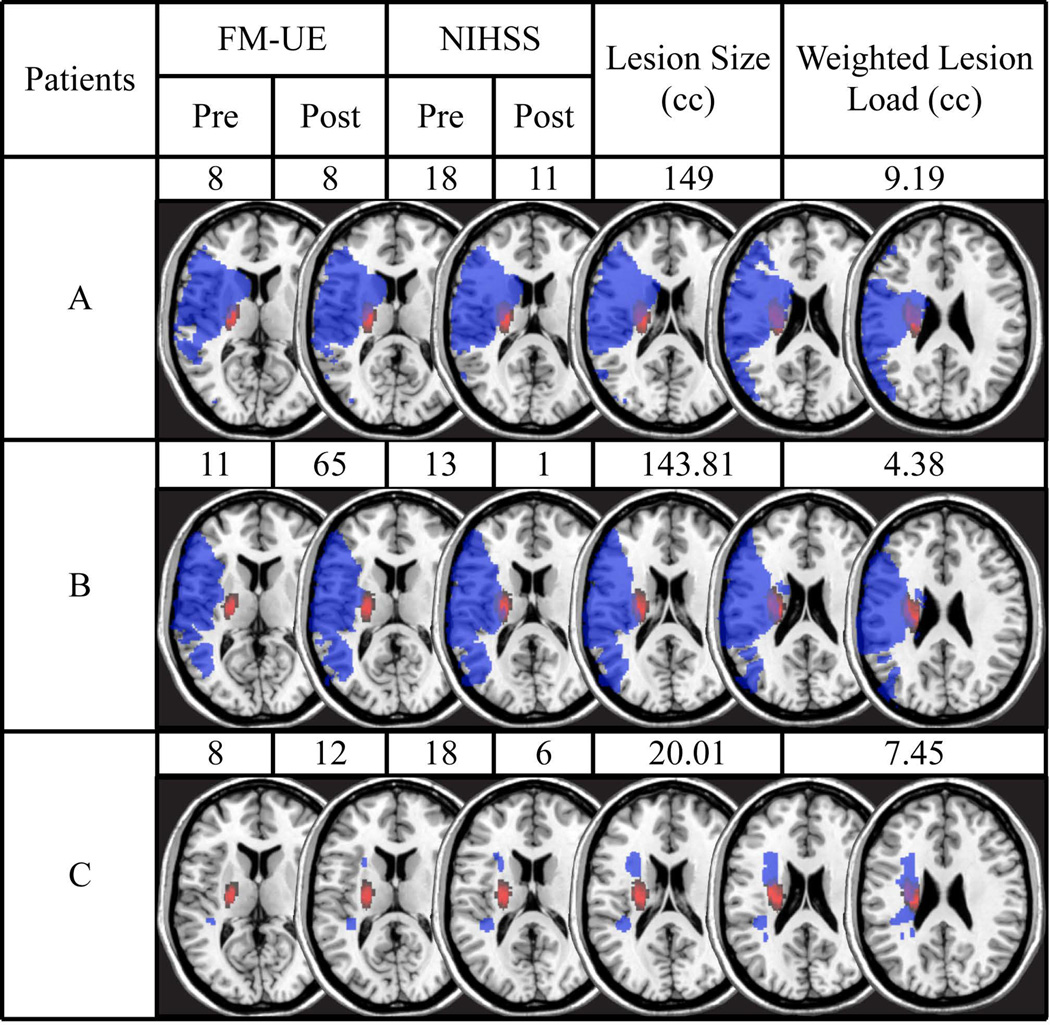
Figure 1.
shows examples of 3 patients with their UE-FM and NIHSS scores (at baseline and 3 months post-stroke) their lesion maps (blue) overlaid onto the probabilistic fiber map (red) as well as their lesion volume and weighted CST lesion load (wCST-LL). The overlap between lesion and CST is displayed in purple. The axial slices depicted correspond to Z= 0, 4, 8, 10, 20, and 28 in Talairach space. A comparison of Patients A and B shows that two similarly sized lesions can have markedly different wCST-LL and, accordingly, results in very different levels of motor impairment both at baseline and 3 months post-stroke. A comparison of Patients A and C shows that two patients have similar wCST-LL and motor recovery, but drastically different lesion volumes.

