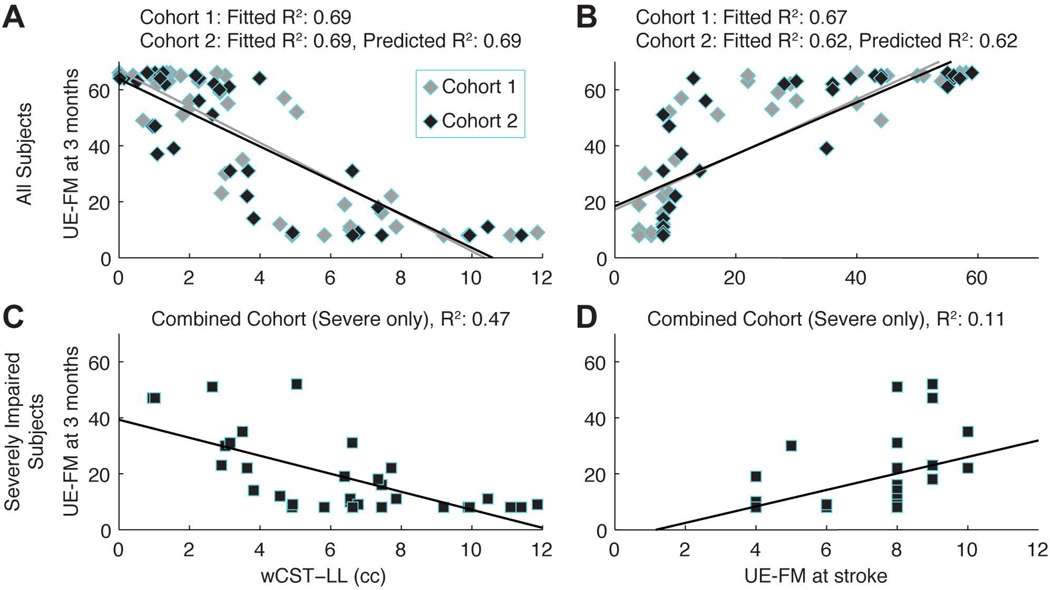
Figure 2.
demonstrates scatter plot and correlation for wCST vs. Initial motor impairment (A): For cohort 1, fitted R2 for wCST-LL is 0.69; for cohort 2, the fitted R2 for wCST-LL is 0.69 and predicted R2 is 0.69; (B): For cohort 1, fitted R2 for initial motor impairment is 0.67; for cohort 2, the fitted R2 for initial motor impairment is 0.62 and predicted R2 is 0.62; (C): R2 for wCST-LL is 0.47 for severely impaired subgroup; (D): R2 for initial motor impairment is 0.11 for severely impaired subgroup.

