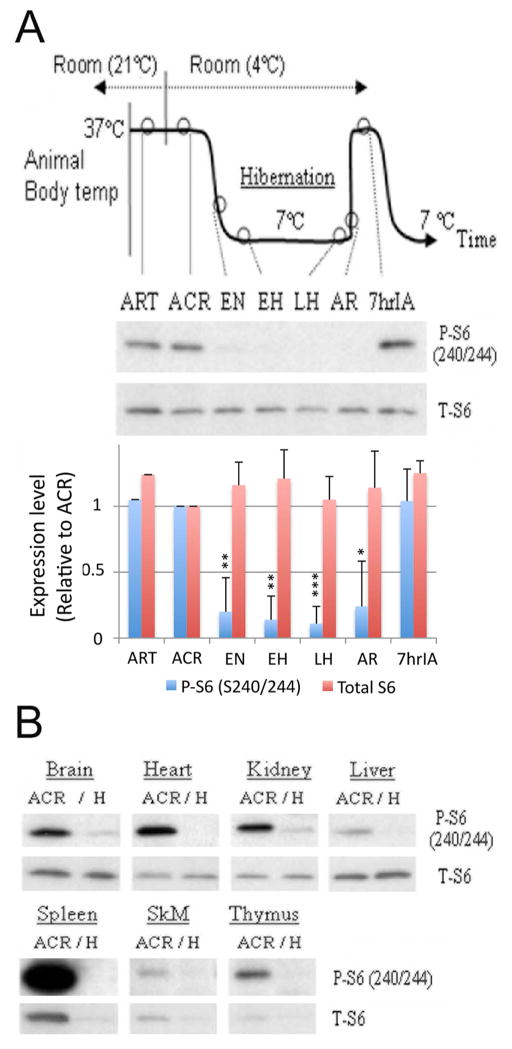
Figure 2. Hibernation bout and rpS6 phosphorylation.
(A) Diagram of hibernation bout (upper panel), representative immunoblots of phospho- and total-rpS6 in the squirrel brains at 7 different phases of the hibernation bout (middle panel), and their quantification summary which are shown as mean ± standard deviation (SD) of three animals (lower panel) are presented. *p<0.05, **p<0.01, ***p<0.001 compared to ACR level by the student’s t-test. ART: active in room temperature; ACR: active in cold room; EN: entrance; EH: early hibernation torpor; LH: late hibernation torpor; AR: arousal; 7hrIA: 7h after interbout started. (B) Comparison of rpS6 phosphorylation in different tissues between active (ACR) and torpor phase (H) squirrels. SkM: Skeletal muscle.

