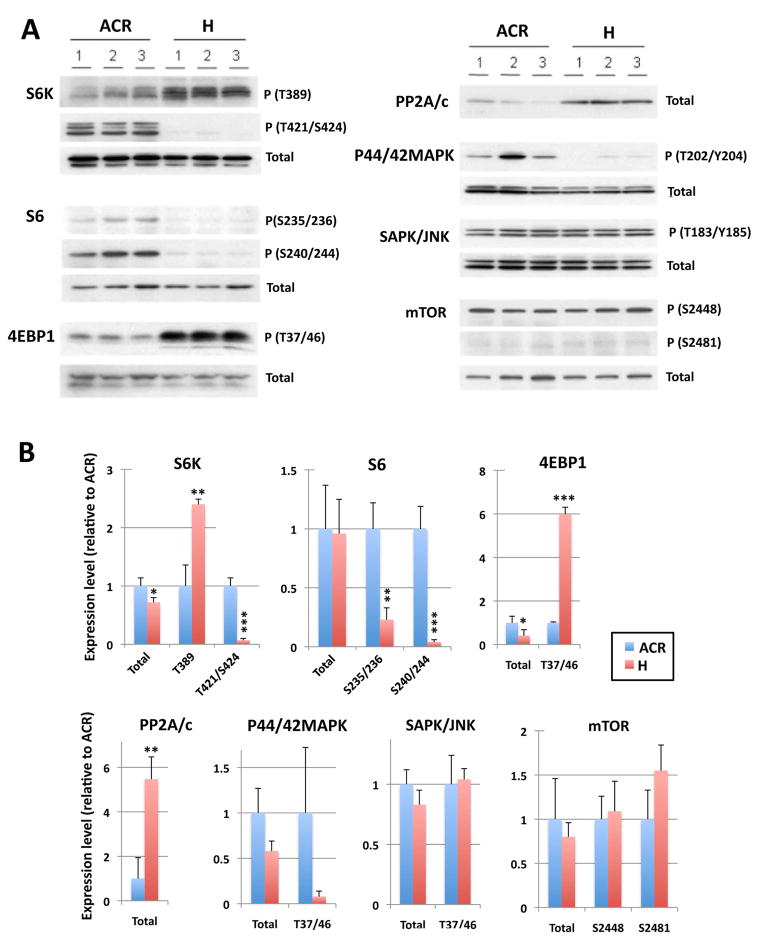
Figure 3. Upstream signal transduction of rpS6 during torpor.
A: Upstream kinases and phosphatases of rpS6 in the brain cortex from 3 animals each of active (ACR) and torpor (H) phases were examined by immunoblotting. Antibodies against phospho- and total- S6K, rpS6, 4EBP1, PP2A/c, p44/42MAPK, SAPK/JNK and mTOR were used. B: Quantative analyses of the immunoblots. Densities of each protein band(s) (including multiple bands which we consider isoforms) were measured, normalized with corresponding actin levels and shown as relative to control (average of three ACR samples). Data are shown as the mean ± SD of three samples. *P<0.05, **P<0.01, ***P<0.001 compared to ACR by the student’s t-test.

