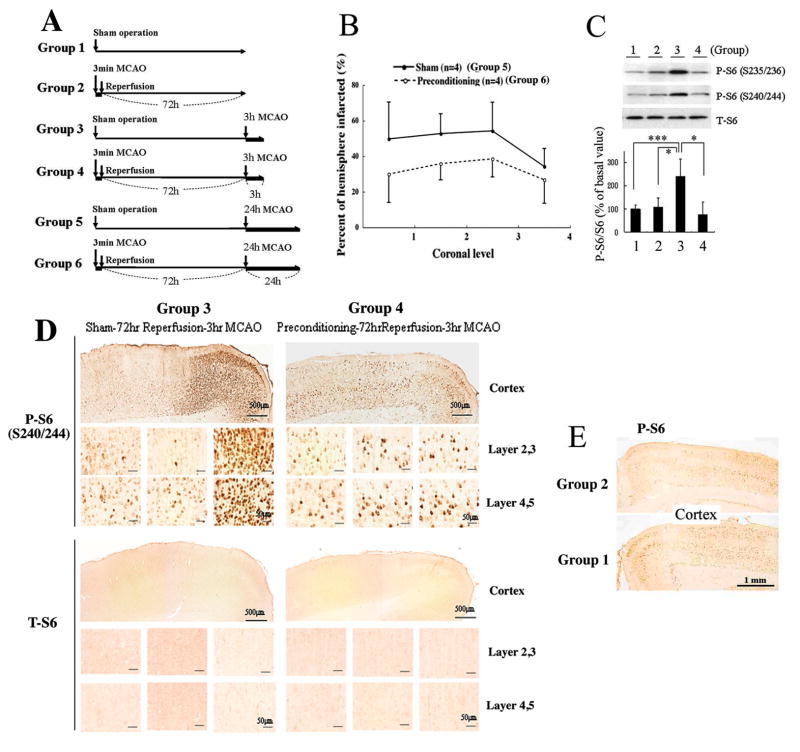
Figure 7. Rat ischemic tolerance model induced by non-lethal 3 min MCAO followed by 72 h reperfusion (in vivo preconditioning).
(A) Outline of general procedure for 6 different groups as descried in the Materials and Methods section; four animals (n=4) within each group. (B) Infarct sizes in the brains from Group 5 and Group 6 animals analyzed at four coronal levels (bregma +1.00, −0.60, −2.20, −3.80). The infarct sizes of preconditioned animals (Group 6) were significantly smaller than the sham-operated animals (Group 5). p=0.0482 by repeated measure ANOVA. (C) Effect of preconditioning on rpS6 phosphorylation. Proteins from cortical samples (MCA perfused area) were extracted and rpS6 phosphorylation (S235/236 or S240/244) and total rpS6 levels were measured. Upper panel: A representative immunoblot; lower panel: densities of phosphorylated rpS6 (S240/244) were measured in each group, normalized by the corresponding total rpS6 densities, and shown as relative to the average of Group 1 (basal level). Results represent the mean ±SD of 4 animals; *P<0.05, ***P<0.005 by the student’s t-test. (D) Immunohistchemistry by phospho-rpS6 antibody (S240/244) and total rpS6 antibody. rpS6 phosphorylation levels along with total rpS6 levels in cerebral cortex of Group 3 and 4 animals were examined and shown at two different magnifications. Scale bars show 500 and 50 μm. Ischemic core (left), transition area (middle), and the peri-infarct area (right) were shown. (E) rpS6 phosphorylation levels before prolonged ischemia with (Group 2) or without (Group 1) preconditioning. Scale bars show 1.0 mm.

