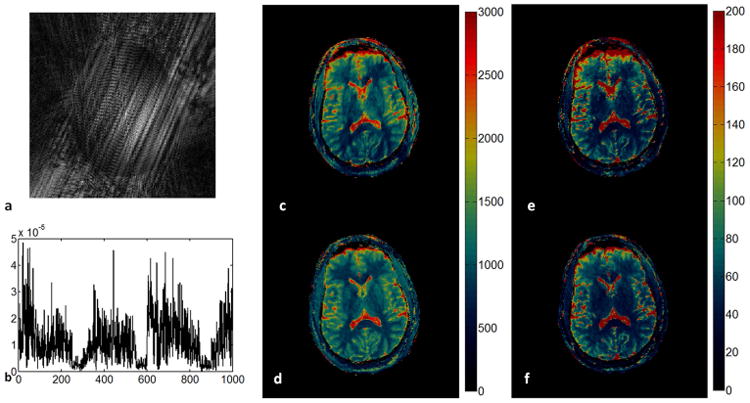
Figure 5. In vivo results of the 2D MRF-Music scan.

(a). An image at the 11th repetition time out of 4000 was reconstructed from only one music trajectory demonstrating the significant errors from undersampling. (b). one example of the acquired signal evolution from the first 1000 time points. (c) and (d): T1 map generated without and with the multi-scale iterative method. (e) and (f): T2 map generated without and with the multi-scale iterative method. 13.02 cm × 7.1 cm, 600 DPI
