
Figure 6. Comparison of the maps obtained from MRF-Music and MRF scans.
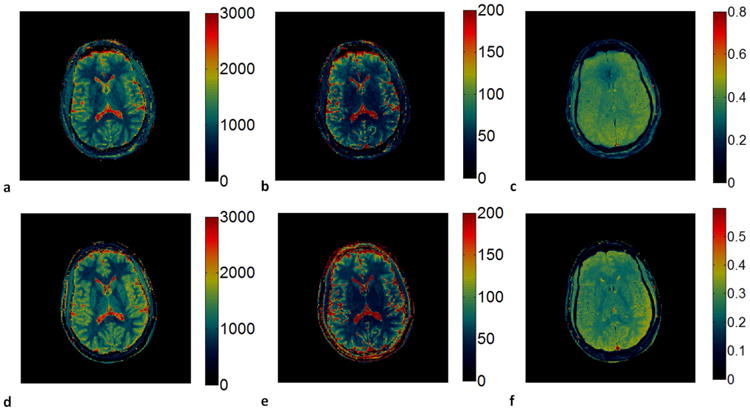
(a)-(c), T1(a), T2 (b) and proton density (c) maps obtained from the MRF-Music sequence. (d)-(f), T1(d), T2(e) and proton density (f) maps obtained from the original MRF sequence. T1 (color scale, milliseconds), T2 (color scale, milliseconds) and M0 (normalized color scale). 13.02 cm × 7.3cm, 600 DPI