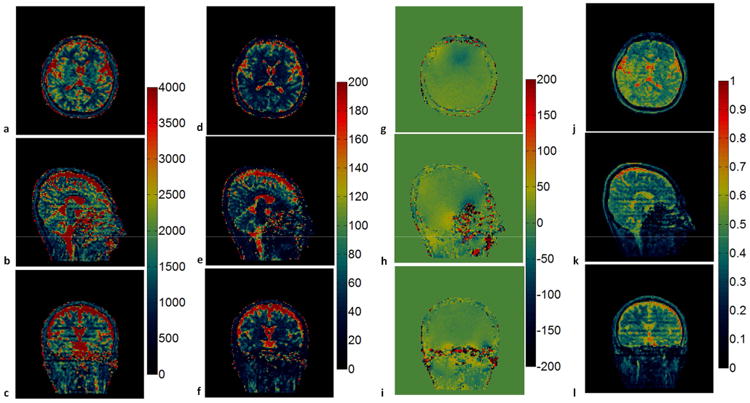
Figure 9. In vivo results of the 3D non-selective MRF-Music scan.

T1 maps (a-c), T2 maps (d-f), off-resonance maps (g-i) and M0 maps (j-l) were shown in the axial, sagittal and coronal views, respectively. T1 (color scale, milliseconds), T2 (color scale, milliseconds), off-resonance (color scale, Hertz) and M0 (normalized color scale). 17.56 cm × 9.68 cm, 600 DPI
