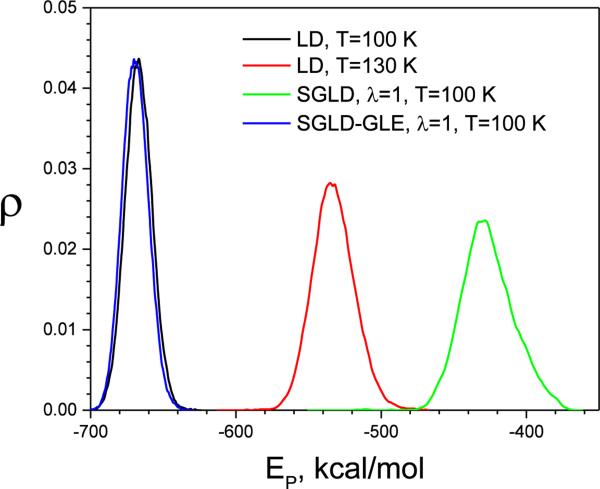
Fig.6.
The potential energy distributions of the liquid argon from LD, SGLD, and SGLD-GLE simulations. All simulations were performed at T=100 K, ξ=10/ps, except that the high temperature LD simulation that was performed at T=150 K. The guiding factor was λ=1 for both the SGLD and SGLD-GLE simulations.

