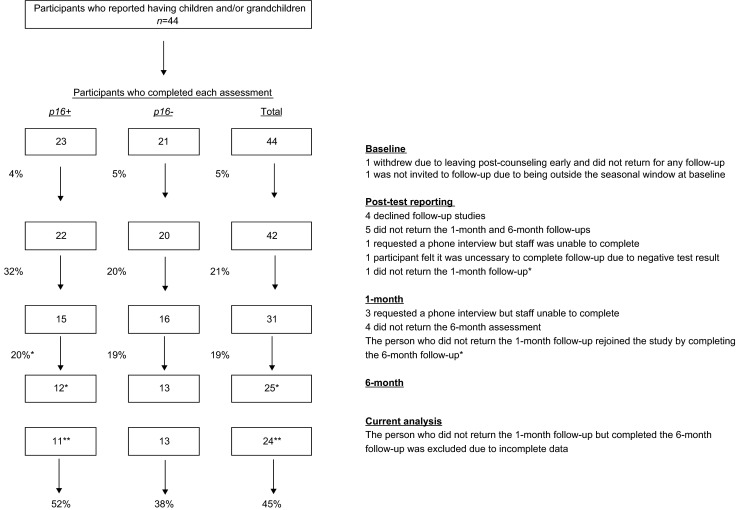
Fig. 1.

Participation across time points for individuals with children or grandchildren. Note: Percentages between boxes represent attrition rates between study time points. Percentages at the bottom of the figure are overall attrition rates from baseline to 6 months for participants included in the current analysis. *Six-month data reflect reinclusion of the participant who did not return for the 1-month follow-up but did return for the 6-month follow-up. **Current analysis does not include the participant that rejoined the study at 6 months due to incomplete data
