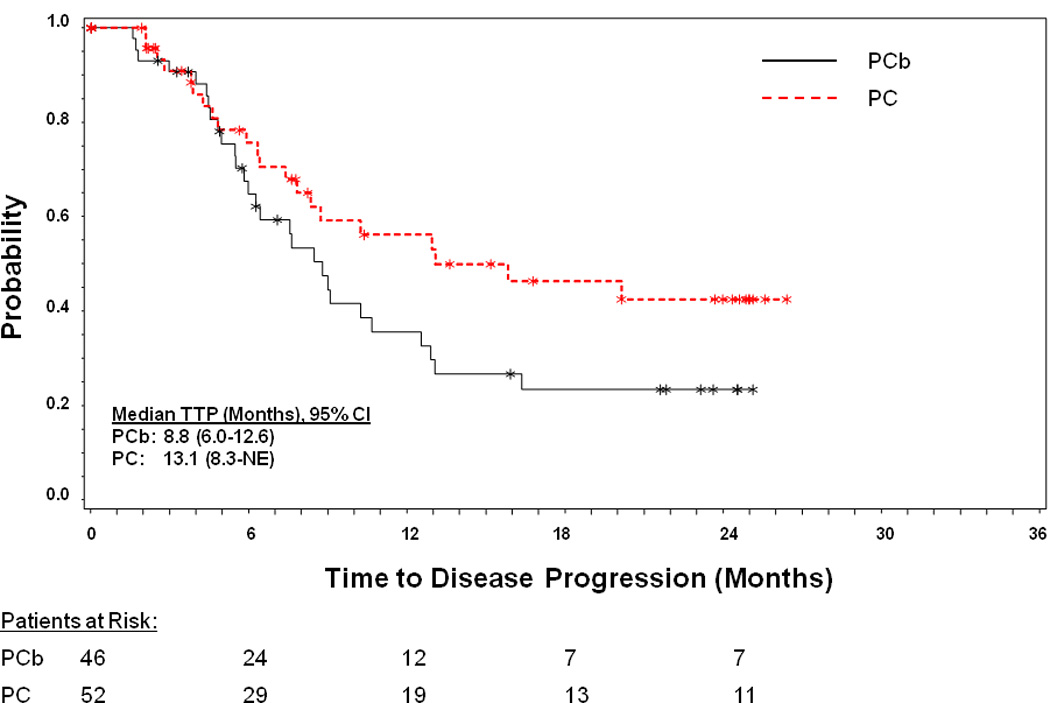
Figure 3. Kaplan-Meier plot of time to progression.

Time to progression was measured from randomization to the first observation of disease progression according to RECIST. Abbreviations: CI=confidence interval; NE=not evaluable; PC=pemetrexed-cisplatin; PCb=pemetrexed-carboplatin; RECIST; Response Evaluation in Solid Tumors; TTP=time to progression; *=censored patients.
