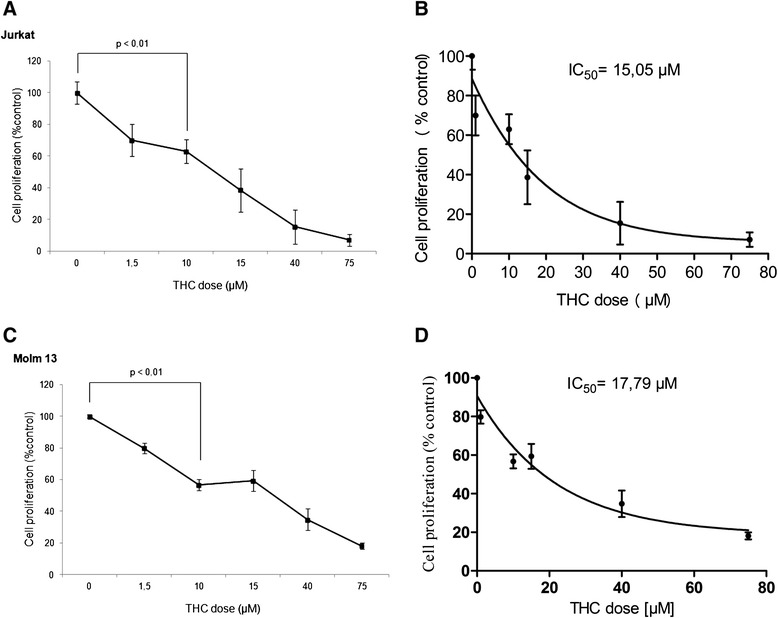
Fig. 1.

Photometric XTT-analysis assaying metabolic active cells in dependence of THC concentration. Representative dose-effect curves for Jurkat (a) and MOLM13 (c) cells treated with THC in a dose-dependent manner are shown on. Student’s t-test analysis reveals significant reduction of proliferating cells as indicated for two doses (statistical significance at p < 0.05). Experiments were performed in triplicates. Linear regression analysis was performed to compute IC50s for both cell lines (b and d)
