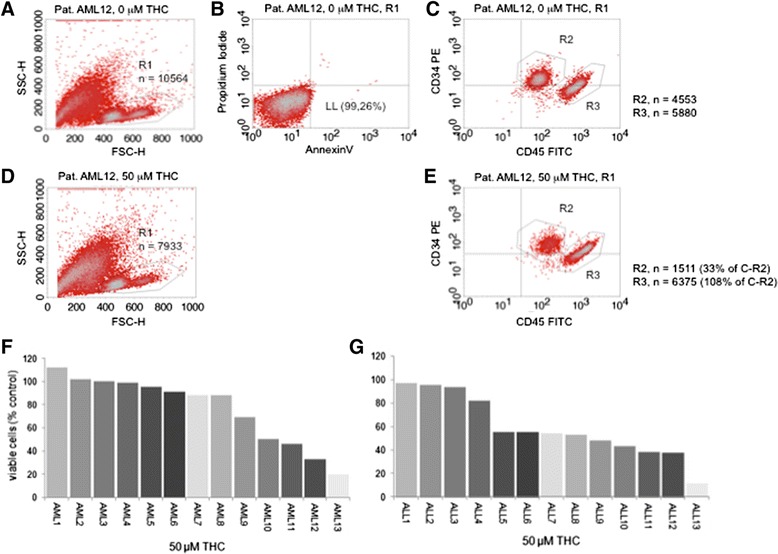
Fig. 3.

Reduction of the viable leukemia cohort upon treatment with THC. a FSC/SSC scatter plot was used to gate (R1) the viable cell population. Counted cells (total) n = 30,000. b Viability of the R1-gated population was confirmed in an annexin V/PI-based apoptosis assay (viable population located in the lower left (LL) section of a quadrant plot). c Immunophenotyping assay to distinguish the CD34 (PE conjugated) and/or CD45low (FITC conjugated) positive leukemia population is shown. This cohort was followed prior to and 48 h after exposure to THC to determine reduction of viable cells in response to THC (d and e). A representative patient sample is shown. Percental waterfall plots are provided for AML (f) and ALL (g) for all tested patient samples
