Fig. 4.

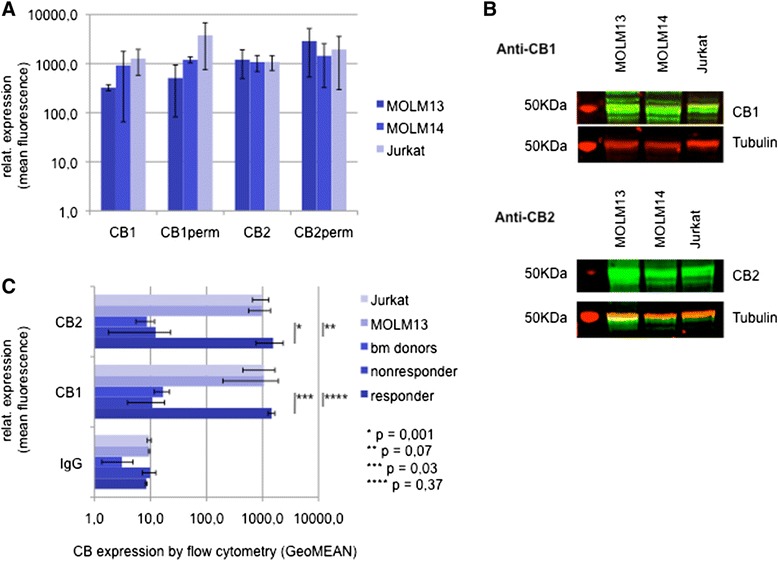
Expression of CB1 and CB2 in acute leukemia. a FACS flow cytometry based analysis of intracellular (CB1/2 perm) and extracellular CB expression levels in MOLM and Jurkat cell lines. b Western immunoblotting expression analysis of CB1 and CB2 in Jurkat and MOLM leukemia cell lines. The major isoform of CB1 (1a long) has a molecular weight of 52 KDa. CB2 is expected at 40-50 KDa. c Exracellular CB1/CB2 expression levels of native leukemia cells (n = 12) and comparatively bone marrow donors (n = 10) and the Jurkat and MOM13 cell lines as assessed by flow cytometry. The responder/nonresponder cohort (n = 4, resp. n = 8) contains patient samples responsive/non-responsive towards THC ex vivo. (*-****) statistical significance at p < 0.05 (Student’s t-test)
