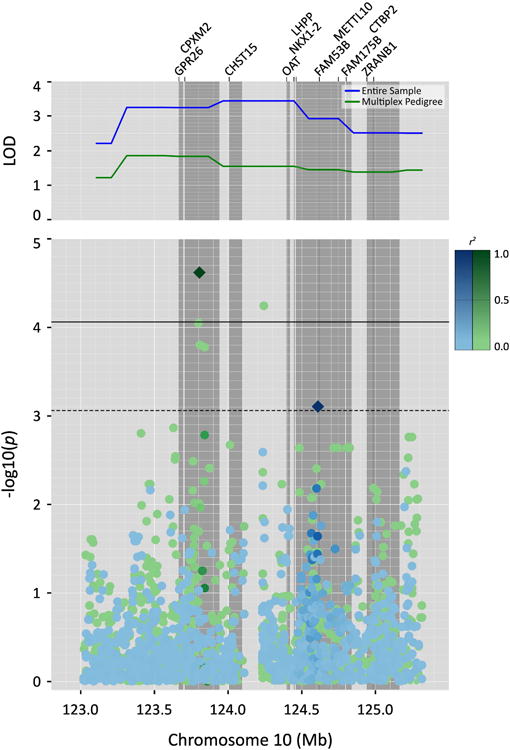
Figure 3.

QTL-specific association analysis within the QTL on chromosome 10 for the continuous depression factor score in the entire sample (blue) and the multiplex MDD pedigree (green). The top plot shows the linkage signal in the entire sample and the multiplex pedigree. The plot below shows the results of association analysis in the same region. Intergenic regions are pale gray and genes are represented by the dark gray bars. The top ranked variant in each subject group is represented by a diamond and the degree of linkage disequilibrium is represented by the color scale.
