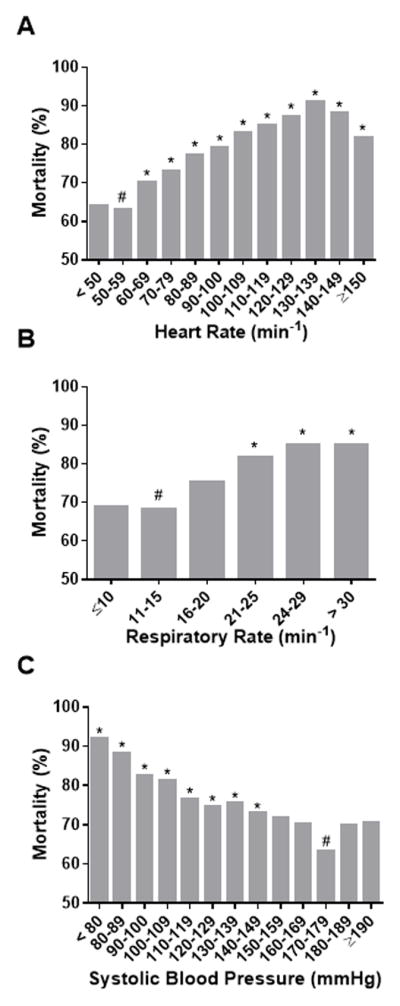
Figure 2. The Association Between Individual Vital Signs and Mortality – Univariate Analysis.

The * indicates statistical significance compared to the reference group (marked with a #) defined as the group with the lowest mortality (50–59 min−1 for heart rate [A], 11–15 min−1 for respiratory rate [B] and 170–179 mm Hg for systolic blood pressure [C]).
