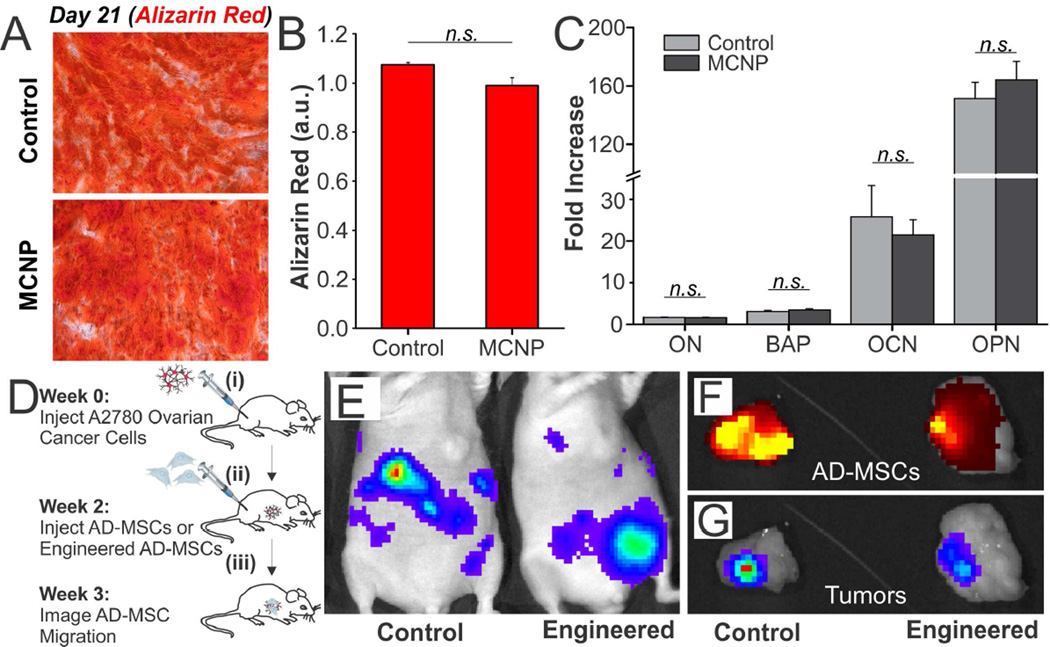
FIGURE 5.
Differentiation and Migration of AD-MSCs Engineered with MCNP-PEI/plasmid Complexes. A) To evaluate osteogenic differentiation, engineered or unengineered AD-MSCs were differentiated for three weeks. Osteogenesis was then quantified via Alizarin Red staining. B) Quantification of staining suggested that there was no statistically significant difference between the two groups (p > 0.05). C) qPCR of key osteogenic genes demonstrated that all four genes were highly expressed over non-differentiated control and that no significant difference was found between the engineered and unengineered AD-MSCs (p > 0.05). GAPDH was used as the housekeeping gene. D) Timeline of the studies used to evaluate the tumor homing ability of the engineered and unengineered AD-MSCs. E) Luciferase was used to identify the A2780 cells. Luminescence imaging shows the establishment of disseminated A2780 tumors. The luminescence intensity goes from blue to red, wherein blue is the weakest and red is the strongest. F) One week after the injection of AD-MSCs, tumors were collected. Fluorescence imaging shows the DiD-labeled engineered and unengineered AD-MSCs. The fluorescence intensity goes from dark red to yellow, wherein dark red is the weakest and yellow is the strongest. G) Luminescence imaging of the conglomerated tumors demonstrates that the AD-MSCs are able to colocalize with the tumors.

