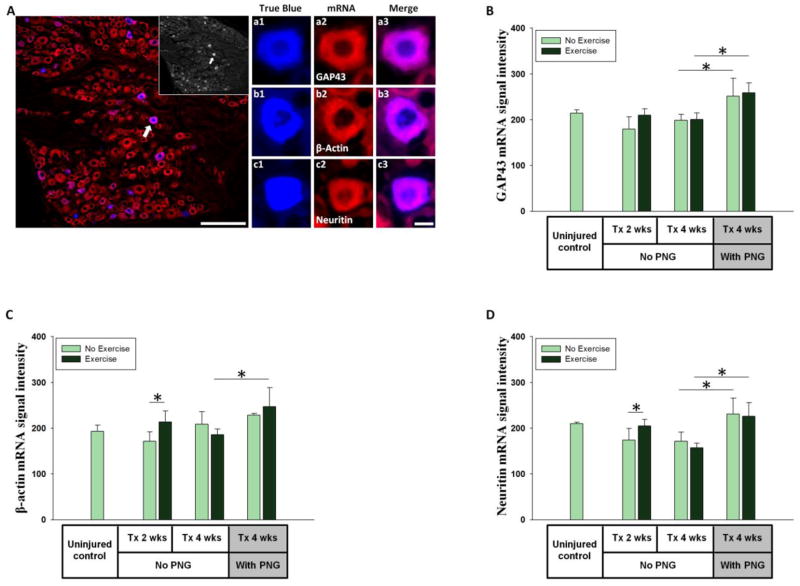
Figure 7. mRNA expression in sensory neurons.
(A) A section from L1 DRG showing regenerating neurons labeled by TB placed at the distal end of a PNG and stained for GAP43 mRNA (scale bar = 200μm). The inset shows TB labeled neurons. a1 shows a magnified image of a TB positive neuron stained for GAP43 mRNA (a2) and a3 shows a merged image. Similarly, b1-b3 and c1-c3 show individual TB positive neurons stained for β-actin and Neuritin mRNAs respectively (scale bar = 10μm). (B, C, D) Y-axis shows average of FISH signal intensity per neuron for GAP43, β-actin, Neuritin mRNAs respectively. X-axis shows the animal groups. * indicates significant difference (p<0.05).

