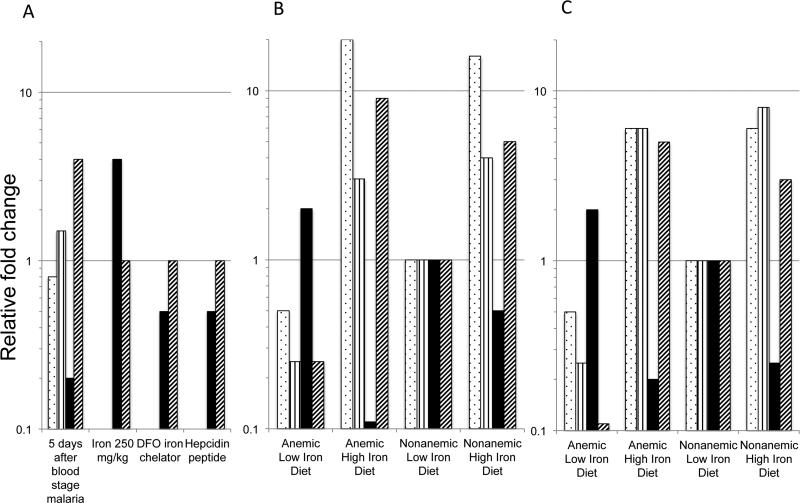
Fig. 5. Model of temporal pattern of iron and hepcidin regulation of Plasmodium liver loads.
A) Relative fold change of measured values compared to untreated control mice for liver nonheme iron (dotted bars), spleen iron (vertical stripe bars), Plasmodium liver load (black bar) and hepcidin levels (diagonal stripe bars) are shown 5 days after a bloodstage murine malaria infection, after iron citrate at 250 mg/kg for 24-48 hours, after desferoximine (DFO) an iron chelator at 250 mg/kg and after hepcidin peptide from reference [13]. B) Two weeks or C) six weeks after low or high iron diets on either anemic or nonanemic mice, the relative liver and spleen nonheme iron, Plasmodium liver loads and hepcidin levels are shown relative to nonanemic mice on a low iron diet as the 1x control.

