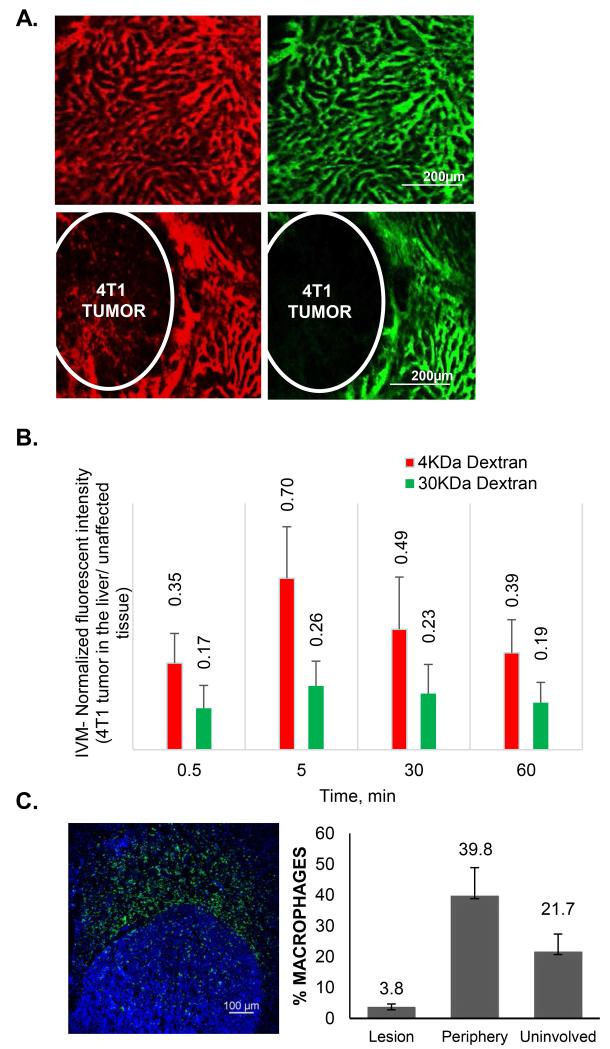
Figure 1. Transport characteristics of tumor lesions in the liver.
(A) Intravital microscopic evaluation of perfusion and diffusion of 3KDa (red) and 40KDa (green) fluorescent dextrans in the normal liver (upper panels) and 4T1 liver metastasis lesions 30 minutes after the intravenous injection. (B) Quantification of fluorescent intensities of the dextrans in the lesions in the liver as normalized to the fluorescence intensity in the unaffected liver. (C) Distribution of the macrophages in the liver with tumor lesions. The macrophages are stained by F4/80 antibody (green) and the number of macrophages inside of the lesion, the periphery of the tumor (40-50 micron from the tumor border) and in the unaffected liver is normalized to the number of cells as detected by nuclear staining (DAPI). Tumor borders are defined by the increased density of nuclei.

