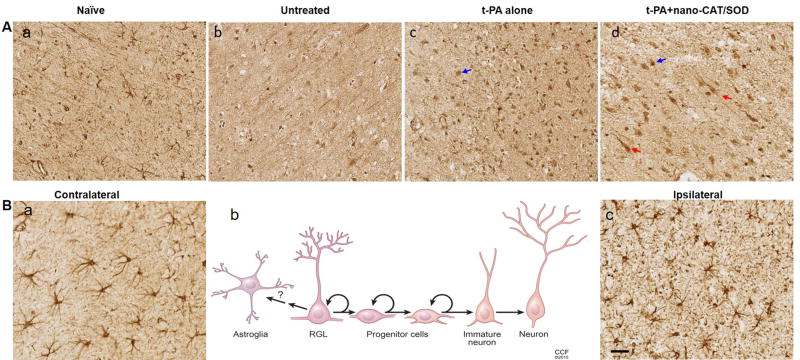
Figure 2. Immunohistochemical analysis of brain sections for GFAP-expressing astrocytes, progenitor cells and radial glia-like (RGL) cells.
Following embolic stroke, animals received different treatments at 3 h and brains were collected 48 h post stroke. Brain sections were stained for GFAP expression. Besides the astrocytes, the GFAP staining also showed various cell types in naïve (A–a), untreated (A–b), tPA-treated (A–c), and tPA + nano-CAT/SOD-treated (A–d) animals. Animals treated with tPA (A–c, blue arrow) and tPA + nano-CAT/SOD (A–d, blue arrow) show round progenitor cells; those treated with tPA + nano-CAT/SOD also show RGL cells (A–d, red arrows). In the GFAP stained brain sections, the astrocyte morphology observed on the ipsilateral and contralateral sides was compared between various groups. The contralateral side (B–a) exhibits normal astrocyte morphology with characteristic star-shaped long extensions, whereas the ipsilateral side (B–c) exhibits astrocytosis, as is evidenced by the altered morphology (swollen and thickened processes, increased GFAP expression). The schematic (B–b) provides a morphological display of the various cell types associated with neurogenesis to provide a comparison of the associated cells vs. the GFAP-positive round progenitor cells and RGL cells. Scale bar = 50 μm. Representative brain section images from three animals in each group are shown.

