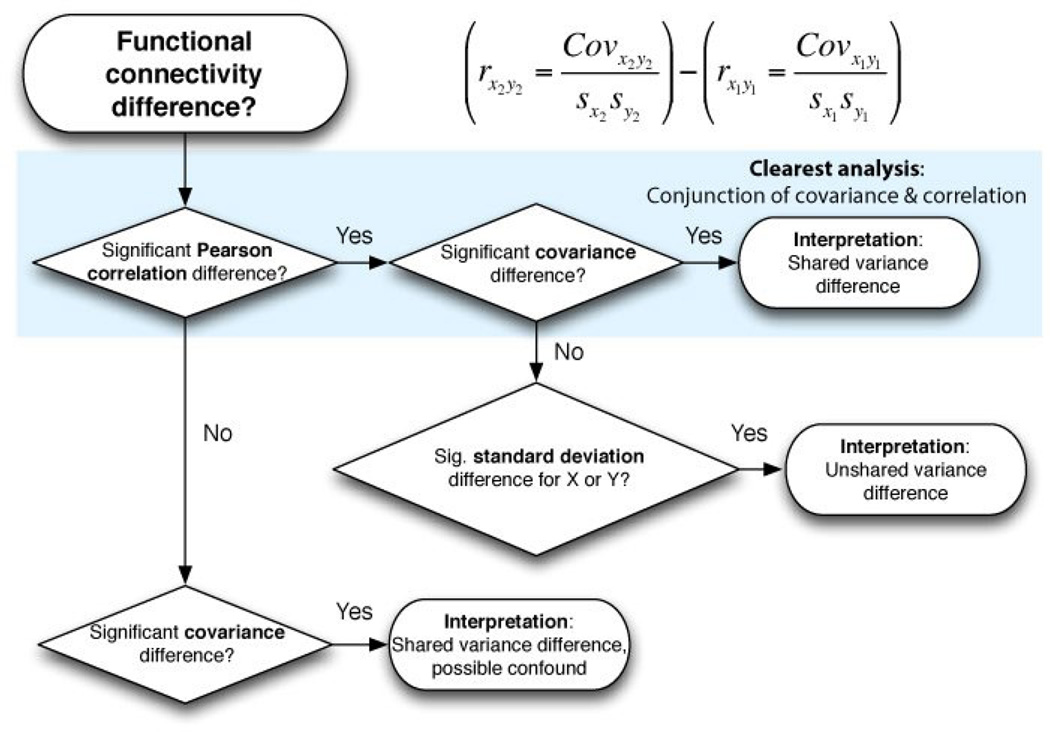
Figure 3.
A flowchart illustrating a “covariance conjunction” approach to interpreting functional connectivity differences. A similar line of reasoning would also work for most functional connectivity measures (not just correlation; e.g., PPI). Note that simply using covariance would result in a simpler line of reasoning: a significant covariance difference signifies a shared variance difference. However, as noted, a potential confound related to a change in overall variance could invalidate a result significant for covariance only. We suggest that the most conservative approach involves conducting both covariance and correlation analyses, assigning the most confidence to results that are consistent across both approaches (the upper-most route in the flowchart).

