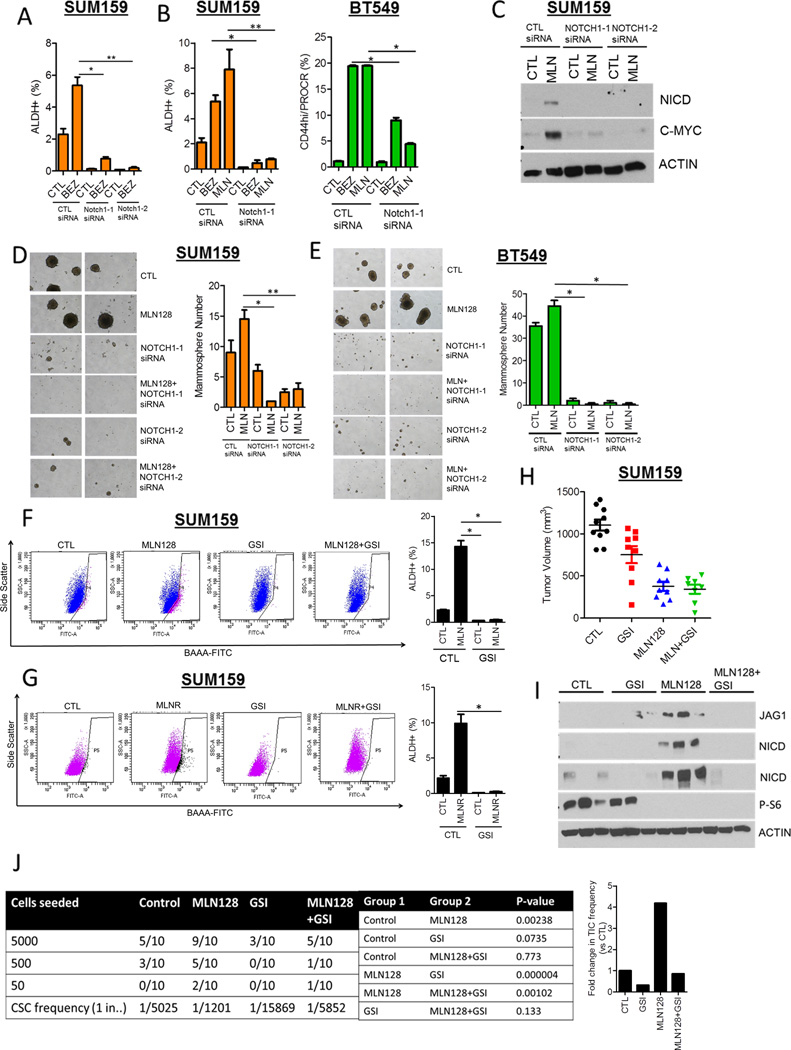
Figure 4. Notch1 downmodulation decreases the induction of CSCs upon inhibition of TORC1/2.
(A) SUM159 cells were transfected with two different Notch1 siRNAs ± 250 nM BEZ235 for 72 h. FACS analysis for ALDH+ cells was performed (*P<0.03; **P<0.001).
(B) SUM159 and BT549 cells were transfected with Notch1 siRNA ± 250 nM BEZ235 or 100 nM MLN128. After 72 h, FACS analysis for ALDH+ or CD44hi/PROCR+ expression was performed (*P< 0.03; **P<0.001).
(C) SUM159 cells were transfected with 2 Notch1 siRNAs ± 100 nM MLN128. After 72 h, immunoblot analysis for NICD, C-MYC and Actin expression was performed.
(D) SUM159 and (E) BT549 cells were transfected with Notch1siRNAs ± 100nM MLN128 for 48 h. Cells were trypsinized and seeded as mammospheres. After 7 days, mammosphere number was determined (*P< 0.03; **P<0.001).
(F) SUM159 cells were treated with 100 nM MLN128 and/or 5 µM GSI-IX for 72 h, followed by FACS analysis for ALDH positivity (*P<0.01).
(G) SUM159 CTL and MLNR cells were treated with 5 µM GSI-IX for 72 h, followed by FACS analysis for ALDH positivity (*P<0.01).
(H) SUM159 xenografts were divided into 4 treatment groups (n=10): vehicle, MLN128 (1 mg/kg ×3/week, p.o.), GSI-IX (10 mg/kg, 3 days on, 4 days off, i.p.), MLN128 + GSI-IX. Tumor volumes of individual xenografts at day 28 are represented.
(I) Lysates from xenografts in each treatment group were analyzed for NICD, JAG1, phospho-S6 and Actin.
(J) In vivo limiting dilution experiment to determine tumor incidence from SUM159 xenografts treated with vehicle, MLN128, GSI-IX and MLN128 + GSI-IX. P-values for pairwise statistical analysis of treatment groups was determined by ELDA (Extreme Limiting dilution Analysis) and displayed.
Fold change in tumor-initiating frequency is represented by the bar graph (right).
Error bars represent mean ± SEM.

