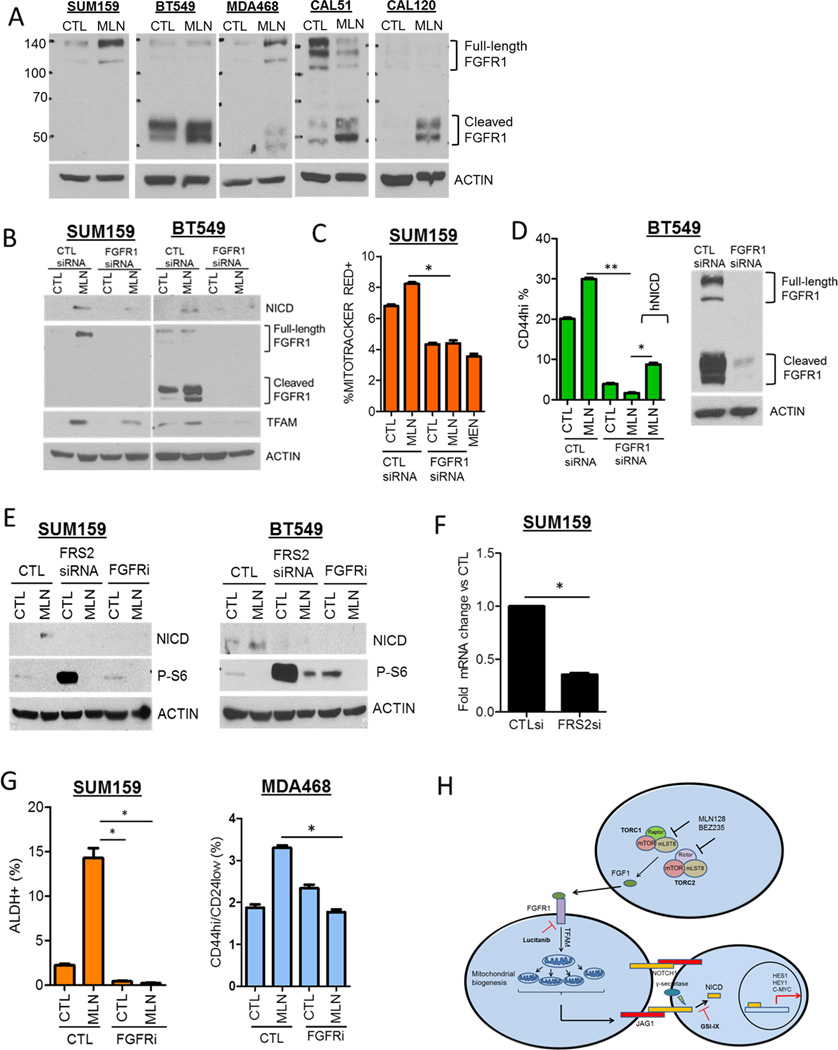
Figure 6. Induction of Notch1 and CSCs upon inhibition of TORC1/2 is FGFR-dependent.
(A) SUM159, BT549, MDA468, CAL51, and CAL120 cells were treated with 100 nM MLN128 for 72 h. Immunoblot analysis for FGFR1 and actin was performed.
(B) SUM159 and BT549 cells were transfected with control or FGFR1siRNA ± 100 nM MLN128 for 72 h. Immunoblot analysis for NICD, FGFR1, TFAM and Actin was performed.
(C) SUM159 cells were transfected with control or FGFR1siRNA ± 100 nM MLN128 for 48 h. FACS analysis for Mitotracker Red was performed. Cells were treated with 5 µM menadione as a positive control (*P=0.003).
(D) BT549 cells were transfected with control vector or GFP-hNICD followed by transfection with CTL or FGFR1 siRNA ± MLN128. After 72 h, FACS analysis for CD44hi cells was performed (*P=0.002;**P<0.001).
(E) SUM159 and BT549 cells were transiently transfected with CTL and FRS2 siRNA or treated with 2 µM lucitanib for 72 h. Immunoblot analysis for NICD, phospho-S6 and Actin expression was performed.
(F) SUM159 cells were transfected with CTL and FRS2 siRNA for 48 h followed by qPCR analysis for FRS2 expression (*P=0.0003).
(G) SUM159 and MDA468 cells were treated with 100 nM MLN128 and/or 2 µM lucitanib for 72 h. FACS analysis for CSC markers was performed (*P< 0.02). Error bars represent mean ± SEM.
(H) Proposed mechanistic model of NICD and CSC induction following TORC1/2 inhibition in TNBC.

