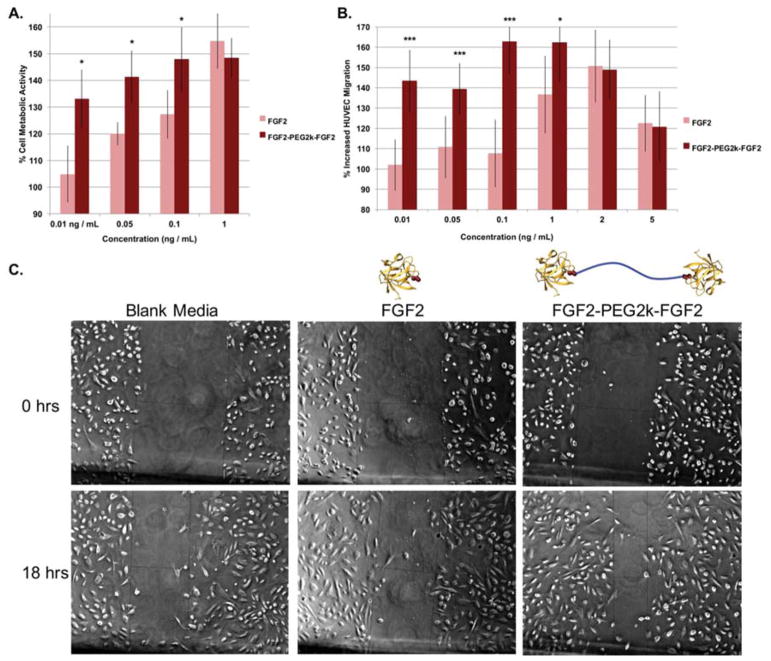
Figure 4.
(a) Metabolic activity of HUVECs at various concentrations of FGF2 and FGF2-PEG2k-FGF2. Each treatment was repeated 5–6 times and the entire study repeated twice. (b) Migration scratch assay of HUVECs treated with FGF2 or FGF2-PEG2k-FGF2 for 18 hours. Each treatment was repeated 4–7 times and the entire study repeated twice (n=9–12 total). The distance across the scratch was measured using ImageJ in pixels and the % increased migration was calculated as 100 – distance at T / distance at T0 *100. For (a) and (b) all samples were normalized to blank media per treatment set and recorded as mean +/− SD.. Statistical analysis was carried out using a student’s t-test. * = p < 0.05. *** = p < 0.001 (c) Representative images of HUVECs (5x magnification) at 18 hours and 0 hours after scratching and treatment with 0.1 ng/mL of each sample.

