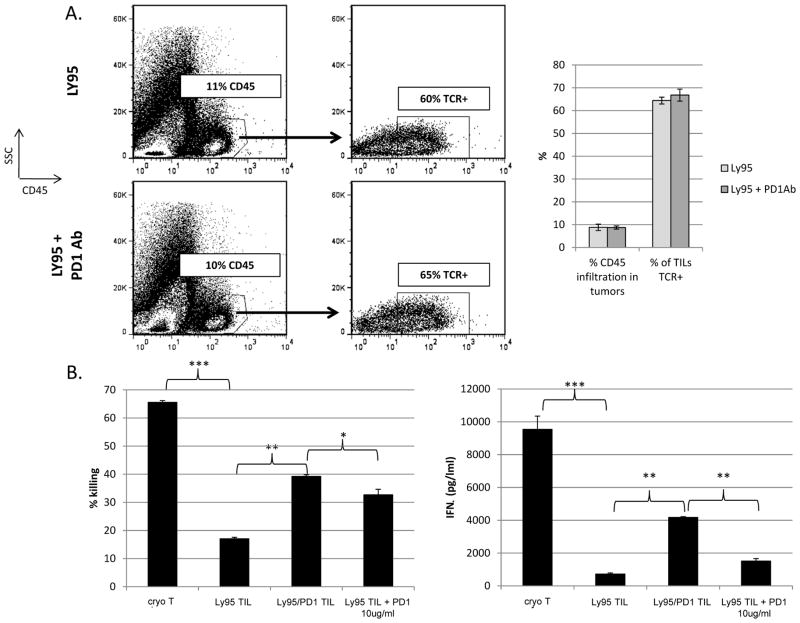
Figure 6. Analysis of TIL from the anti-PD1 animal study.
At Day 42 in the study shown in Figure 5, flank tumors from Ly95 and Ly95 + PD1 Ab treated mice were harvested, digested and processed into single-cell suspension.
A) FACS analysis using anti-hCD45 (upper panels) revealed equal degree of TIL infiltration. FACs analysis using the TCRVβ13.1 antibody, showed an equal percentage of Ly95 TCR+ cells in both groups. Dot-plots display representative analyses from experiment with pooled samples. Bar graph displays averaged results ± S.E. from independently experiment repeats analyzing pooled samples.
B) Purified TILs (see Figure 2 Legend) from each group were cocultured with A549-A2-ESO tumors at 20:1 E:T ratio for 18hrs. TILs from the Ly95 group demonstrated profound hypofunctional killing and cytokine secretion ability. TILs from the Ly95 + anti-PD1 antibody group demonstrated significantly better killing and cytokine secretion ability. When 10ug/ml of anti-human PD1 Ab was added to the coculture of Ly95 TIL, killing ability was partially restored (p<0.05). However, TIL function even when exposed to PD1 Ab was not has high as that of TILs isolated from Ly95 + PD1 Ab treated group (* p<0.05, ** p<0.01, *** p<0.001). Bar graphs display average values ± S.E. from triplicates.

